Ask a new trader how they measure success and most will say win rate. How many trades out of ten did I get right? It feels like the obvious scoreboard.
It’s also incomplete. A trader who wins only four trades out of ten can finish ahead if the winners are much larger than the losers. A trader who wins eight trades out of ten can still lose money if the two losses are bigger than all eight wins combined. Win rate tells you how often you’re right. It says nothing about how much you make when you are right, or how much you lose when you’re wrong.
That missing piece is the risk reward ratio. It compares what you stand to lose on a trade with what you stand to gain, and you set it before you click the buy or sell button. Combined with win rate, it determines whether a strategy can make money over many trades.
This guide covers the full picture. You’ll learn the definition, the formula, and how to calculate a risk to reward ratio by hand. You’ll see the relationship between the ratio and the breakeven win rate, including a reference chart. We’ll look at what counts as a good ratio, compare 1:2 and 1:3, and cover day trading, forex, stocks, crypto, and gold. We’ll also look at the indicators and tools available on MetaTrader 4, MetaTrader 5, and TradingView, including a safety note about “free download” files. Then we finish with position sizing, common mistakes, and an honest look at the limits.
One theme runs through everything: the ratio only means something alongside win rate and position sizing.
Educational content only. This guide explains a trade-planning concept. It is not financial advice, a recommendation to buy or sell anything, or a promise of any result. All prices and trades in this article are hypothetical. Trading involves real risk of loss.
What Is Risk Reward Ratio in Trading?
The risk reward ratio is a measure that compares how much you could lose on a trade to how much you could gain. If you risk 1 unit of money to potentially make 3 units, your risk reward ratio is 1:3.
You’ll see this idea written in several ways. People search for the risk-reward ratio, the risk to reward ratio, the risk and reward ratio, the ratio risk reward, or just R:R. They all describe the same concept. The risk reward ratio definition in trading is the same no matter which phrase you use.
Risk and Reward Defined
Two distances define every trade:
- Risk is the distance from your entry price to your stop loss. It’s what you lose if the trade goes against you and the stop is triggered.
- Reward is the distance from your entry price to your take profit level. It’s what you gain if the trade reaches your target.
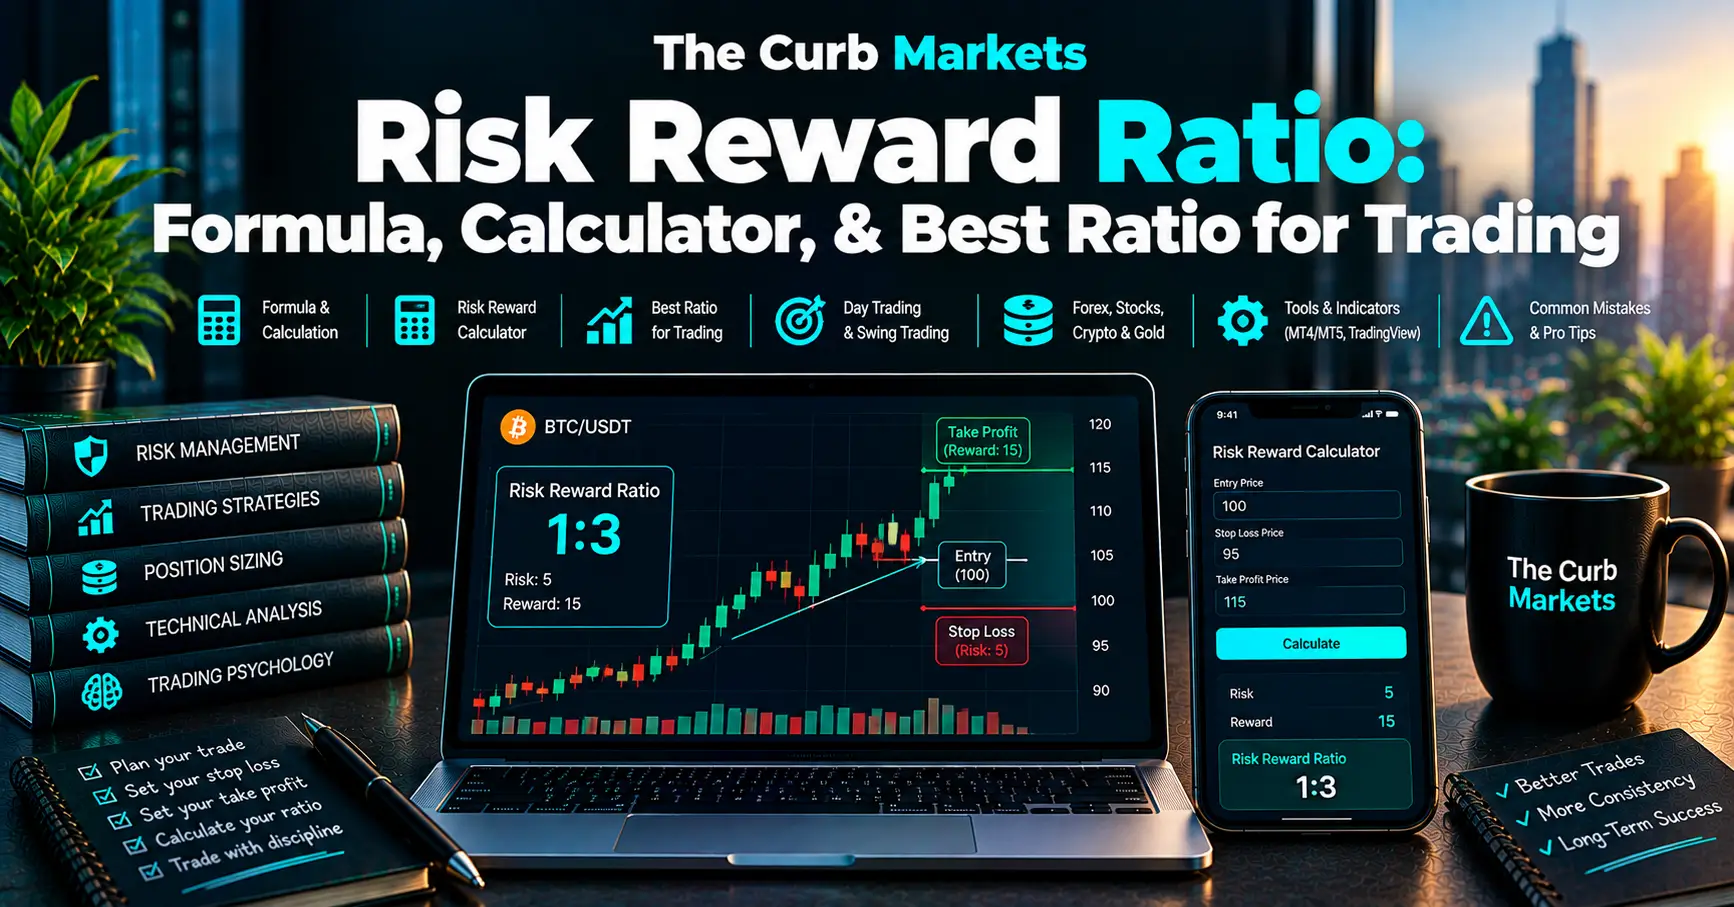
Imagine buying at 100, placing a stop at 95, and setting a target at 115. Your risk is 5 points and your reward is 15 points. The reward is three times the risk, so the ratio is 1:3.
It Is Decided Before You Enter
This is the key practical point. The ratio is a planning tool, and you determine it before you enter. You pick the entry, the stop, and the target, and the ratio follows from those three prices.
That means the ratio describes what you intend to happen, not what will happen. The trade might stop out. The trade might reach only half the target. The market might gap past your stop. The ratio is the shape of the plan, and reality can differ from it.
Why Traders Care
Knowing your risk reward ratio before entering forces useful discipline:
- It makes you define where you’re wrong (the stop) before you’re emotionally invested.
- It makes you ask whether the potential reward justifies the risk.
- It lets you compare different setups on equal terms.
- It connects directly to how often you need to win to break even, which we’ll cover in Section 5.
A trade where you risk a lot to gain a little needs to win very often. A trade where you risk a little to gain a lot can lose most of the time and still work. The ratio is how you see that trade-off clearly.
Risk Reward Ratio Formula and How to Calculate It
Calculating the ratio takes a few seconds once you know your three prices. Here is the risk reward ratio formula and how to use it.
The Formula
For any trade, find the risk distance and the reward distance. Then divide reward by risk.
Risk distance = |entry price − stop loss price|
Reward distance = |take profit price − entry price|
Risk reward ratio = reward distance ÷ risk distance
The result is the “X” in 1:X. If reward divided by risk equals 3, your ratio is 1:3. If it equals 1.5, your ratio is 1:1.5. If it equals 0.5, your ratio is 1:0.5, which means you’re risking more than you stand to gain.
A Note on Notation
Here is something that confuses many readers when they compare websites. Different sources write this ratio in opposite directions.
This article uses one consistent convention throughout:
Ratios are written as 1:X, where risk is normalized to 1 and X is the reward. Risking 1 to make 3 is written 1:3, and the calculation is reward distance divided by risk distance, which equals 3.
Other sources may write the same trade differently:
- Some write it as 3:1 (reward to risk).
- Some divide risk by reward, which gives 0.33 for the same trade.
- Some write “1:3” but mean something else, so it’s worth reading their definition.
The trade is identical in every case. Only the writing differs. When you read another article, check which direction it uses before comparing numbers. A recommendation of “at least 2:1” on one site and “at least 1:2” on another may mean exactly the same thing.
Worked Example: Long Trade
A long trade profits when price rises. All numbers here are hypothetical.
- Entry: 100
- Stop loss: 95
- Take profit: 115
Step 1: Risk distance. 100 − 95 = 5
Step 2: Reward distance. 115 − 100 = 15
Step 3: Divide reward by risk. 15 ÷ 5 = 3
Result: the risk reward ratio is 1:3. For every 1 unit you risk, the plan aims to make 3. This is also what people mean when they search for a risk reward ratio 3 setup.
Worked Example: Short Trade
A short trade profits when price falls, so the stop sits above the entry and the target sits below it. The formula direction flips, but the logic stays the same.
- Entry (sell): 100
- Stop loss: 105
- Take profit: 85
Step 1: Risk distance. 105 − 100 = 5
Step 2: Reward distance. 100 − 85 = 15
Step 3: Divide reward by risk. 15 ÷ 5 = 3
Result: again, 1:3. The absolute value signs in the formula handle the direction. Whatever the side of the trade, risk is the distance to the stop, reward is the distance to the target, and the ratio is reward divided by risk.
A Third Quick Example
Suppose you buy at 50, with a stop at 48 and a target at 53.
- Risk: 50 − 48 = 2
- Reward: 53 − 50 = 3
- Ratio: 3 ÷ 2 = 1.5, so 1:1.5
Not every ratio is a whole number. Many real setups land between the round figures, and that’s fine.
Risk Reward Ratio Calculator: Manual and Tools
If you’ve searched for a risk reward ratio calculator, you’ve probably seen plenty. They’re useful, but you rarely need them.
Most Platforms Calculate It for You
Most charting and trading platforms can show the ratio once you set three prices: entry, stop, and target. Many include a position or risk/reward drawing tool that shows the three levels on the chart and prints the ratio beside them. We’ll cover this in Section 10.
Calculating by Hand in Ten Seconds
You can do the math in your head with this quick routine:
- Subtract entry and stop to get risk.
- Subtract target and entry to get reward.
- Divide reward by risk.
If the result is 2, you have 1:2. If it’s 3, you have 1:3. If it’s below 1, you’re risking more than you stand to gain.
A quick mental shortcut: how many times does the stop distance fit inside the target distance? If you can fit the stop distance into the target distance three times, the ratio is 1:3.
What Standalone Calculators Typically Ask For
Standalone online calculators vary, but they usually ask for some combination of:
- Entry price
- Stop loss price
- Take profit price
- Position size (shares, lots, contracts, or units)
- Sometimes account size and risk percentage, to work out how large the position should be
With position size, a calculator can show the monetary amounts too: how much you’d lose at the stop and how much you’d gain at the target.
Include Your Costs
A simple calculator often ignores trading costs, which can change the picture. Spreads, commissions, and slippage all reduce the real reward and increase the real risk.
Here’s a hypothetical example. You plan a trade with entry at 100.00, stop at 99.50, and target at 101.00.
- Planned risk: 0.50
- Planned reward: 1.00
- Planned ratio: 1:2
Now suppose total round-trip costs (spread plus commission) amount to 0.10 per unit.
- If the stop is hit, you lose 0.50 + 0.10 = 0.60
- If the target is hit, you gain 1.00 − 0.10 = 0.90
- Effective ratio: 0.90 ÷ 0.60 = 1:1.5
The planned 1:2 trade is actually a 1:1.5 trade after costs. That’s a big change, and it’s why a good risk reward ratio calculator, or your own spreadsheet, should account for costs, especially on short-term trades with small stops. We’ll return to this in the day trading section.
How Does Risk Reward Ratio Work? The Win Rate Connection
The ratio doesn’t work alone. To see how the risk reward ratio works in practice, you need to connect it with win rate, which is how often your trades reach their targets.
Breakeven Win Rate Formula
The breakeven win rate is the percentage of trades you must win just to break even, ignoring costs. The formula is:
Breakeven win rate = 1 ÷ (1 + R)
Here, R is the reward side of the 1:X ratio. For a 1:2 ratio, R = 2. For a 1:3 ratio, R = 3.
Check it with 1:2:
- Breakeven win rate = 1 ÷ (1 + 2) = 1 ÷ 3 = 33.3%
To see why this works, take 3 trades at 1:2 risking 100 each. If you win 1 and lose 2, you gain 200 and lose 200, so you’re even. One win in three is 33.3%.
Risk Reward Ratio Chart
This table shows the breakeven win rate for common ratios. These figures are pure arithmetic, before costs.
| Risk Reward Ratio | R (reward side) | Breakeven Win Rate |
|---|---|---|
| 1:1 | 1 | 50% |
| 1:1.5 | 1.5 | 40% |
| 1:2 | 2 | 33.3% |
| 1:3 | 3 | 25% |
| 1:4 | 4 | 20% |
| 1:5 | 5 | 16.7% |
Read it like this: with a 1:3 ratio, you could lose three out of four trades and still break even. With a 1:1 ratio, you’d need to win half your trades just to stay even.
The chart also explains why a higher ratio is attractive: it lowers the win rate you need. But that’s only half the story, because a higher ratio usually means a larger target, and larger targets are reached less often. We’ll cover that trade-off in Sections 6 and 7.
Remember that this is breakeven, not profit. To make money, your actual win rate must be higher than the figure in the table, and costs push the true breakeven higher still.
Expectancy: The Number That Actually Matters
Expectancy tells you how much you’d expect to make or lose per trade on average over many trades. The formula is:
Expectancy = (win rate × average win) − (loss rate × average loss)
Here’s a hypothetical example. You trade a 1:2 setup, risking 100 per trade, so your average win is 200 and your average loss is 100. Your win rate is 40%, and your loss rate is therefore 60%.
- Expectancy = (0.40 × 200) − (0.60 × 100)
- Expectancy = 80 − 60 = +20 per trade
On average, this strategy would gain 20 per trade over a large number of trades.
It’s often easier to express the same thing in R multiples, where 1R equals the amount you risk. With a 1:2 ratio, a win is +2R and a loss is −1R:
- Expectancy = (0.40 × 2R) − (0.60 × 1R) = 0.8R − 0.6R = +0.2R
Now compare a trader with a higher ratio but a lower win rate. Suppose a 1:3 setup wins only 20% of the time:
- Expectancy = (0.20 × 3R) − (0.80 × 1R) = 0.6R − 0.8R = −0.2R
This strategy loses money, despite its attractive 1:3 ratio. A win rate of 20% is below the 25% breakeven for 1:3.
The Takeaway
The ratio alone says nothing about profitability. A high ratio with a very low win rate can still lose money. A modest ratio with a high win rate can be very profitable. The two numbers only make sense together, and expectancy is how you combine them.
One more practical point. Strategies with low win rates and high ratios come with long losing streaks. If your win rate is 25%, losing many trades in a row is a normal part of the process. As arithmetic, if each trade independently has a 75% chance of losing, the chance of five losses in a row in any given run of five is about 24%, and ten in a row is about 5.6%. Actual trades are rarely perfectly independent, but the point stands: you need to be able to tolerate the drawdowns that come with your win rate.
What Is a Good Risk Reward Ratio?
People often ask: what is the best risk reward ratio? How much risk reward ratio is good? What is the recommended risk reward ratio in trading? The honest answer starts with an admission: there is no single number that’s right for everyone.
The Commonly Cited Baseline
A widely recommended baseline is a minimum of around 1:2. Many traders prefer 1:3 or better. These are rules of thumb, not laws. The reasoning is that at 1:2, you only need to win about a third of your trades to break even, which gives you a comfortable margin for error.
A 1:1 ratio is workable in theory, but it demands a win rate above 50% just to break even, before costs. For many traders that’s a hard target to reach consistently.
It Depends on Strategy and Win Rate
The ratio you need depends on how often your strategy wins.
- Trend following strategies typically accept many small losses and a few large wins. The win rate is often lower, so these approaches generally need a higher ratio to compensate.
- Mean reversion strategies, which trade back toward an average, often have higher win rates with smaller targets. They can work with a lower ratio, provided the win rate is truly high enough.
So a ratio that suits one strategy can be a disaster for another. A mean reversion trader running a 1:0.5 ratio would need a very high win rate to break even (66.7%). If their real win rate is 55%, they lose money despite winning more than half their trades.
The right question isn’t “what is the best ratio?” It’s “what ratio, combined with my real win rate, gives a positive expectancy after costs?”
The Trap of Chasing a High Ratio
Many beginners reason that a bigger ratio must be better, so they set targets further and further away. That’s a trap.
A target the market rarely reaches lowers your real win rate. If you move a target from 2R to 6R, the breakeven win rate falls from 33.3% to 14.3%, but the percentage of trades that actually reach 6R may fall by more than that. The math on paper looks great. The results in practice can be worse.
The honest approach:
- Place targets where the market has a reasonable chance of going, such as the next significant support or resistance zone.
- Don’t invent a target to produce a ratio. If the logical target only gives 1:1.2, the honest conclusion may be to skip the trade.
- Test your assumptions on historical data or a demo account before relying on them.
A good risk reward ratio is one that fits your strategy, matches realistic targets, and survives the cost of trading.
1:2 vs. 1:3 Risk Reward Ratio
These two ratios are the most commonly discussed, so it’s worth comparing them side by side. This section doesn’t declare a winner, because neither one is universally better.
What Each Means in Plain Terms
1:2 risk reward ratio: for every 1 unit you risk, you aim to make 2. If you risk 100, your target pays 200.
1:3 risk reward ratio: for every 1 unit you risk, you aim to make 3. If you risk 100, your target pays 300. This is the setup people have in mind when they search for a risk reward ratio 3 approach.
Breakeven Win Rates
| Ratio | Reward per 1 Risked | Breakeven Win Rate |
|---|---|---|
| 1:2 | 2 | 33.3% |
| 1:3 | 3 | 25% |
At 1:2, you need to win roughly one trade in three. At 1:3, you need to win one trade in four. Both are lower than the 50% needed at 1:1.
The Trade-Off
On paper, 1:3 looks better because the breakeven win rate is lower. But the comparison hides a trade-off.
For the same stop distance, a 1:3 setup needs a target that is 50% further away than a 1:2 setup. If the stop is 5 points, a 1:2 target is 10 points away and a 1:3 target is 15 points away. Price generally reaches nearer targets more often than farther ones, so the 1:3 target is likely to be hit less frequently.
So the real question is whether the drop in win rate from using the farther target is smaller or larger than the benefit of the lower breakeven threshold. That depends on the market, the setup, and the chart. Sometimes the nearer target has a better expectancy. Sometimes the farther one does. There’s no universal answer, and anyone who claims one ratio always beats the other is oversimplifying.
A Practical Way to Compare
If you want to compare 1:2 and 1:3 for a particular setup:
- Record many past trades of that setup (or backtest it).
- For each, note how far price traveled in your favor before hitting the stop.
- Calculate the percentage of trades that would have reached 2R and 3R.
- Compute expectancy for each target.
Whichever gives the higher expectancy after costs, for that specific setup, is the better fit for it. This also means the answer can differ between setups and markets.
Best Risk Reward Ratio for Day Trading
People often search for the best risk reward ratio for day trading, as if one number existed. As with other styles, the honest answer is that it depends. But day trading does have features that change the calculation.
Tighter Stops and Targets
Day traders work on short timeframes, so their stops and targets are usually small in price terms. A stop might be a fraction of a percent away from entry.
This matters because fixed trading costs consume a larger share of a small trade. Revisit the example from Section 4. The planned 1:2 trade became 1:1.5 after a cost of 0.10 on a 0.50 stop. Make the stop smaller and the effect gets worse. If the stop were 0.20 with a 0.40 target, the same 0.10 cost would give:
- Loss at the stop: 0.20 + 0.10 = 0.30
- Gain at the target: 0.40 − 0.10 = 0.30
- Effective ratio: 0.30 ÷ 0.30 = 1:1
The planned 1:2 setup has become a 1:1 trade in practice, and the breakeven win rate has jumped from 33.3% to 50%. That’s the cost of trading small distances.
Higher Trade Frequency
Day traders also take many more trades, so costs compound. A small per-trade cost, multiplied by many trades, can eat a lot of the account’s edge. For this reason, day traders should calculate the effective ratio, including spread and commissions, rather than relying on the planned figure.
What This Means for Choosing a Ratio
The practical implications:
- Measure the ratio after costs, not before.
- Be realistic about how far price tends to travel intraday relative to your stop. A 1:4 target may simply be out of reach on a quiet session.
- Avoid stops so tight that normal noise triggers them. A stop that is too close can produce a great-looking ratio on paper and a poor win rate in reality.
- Prefer fewer, cleaner setups where the ratio and context both support the trade.
Contrast With Swing Trading
Swing traders hold positions for days or weeks. They use wider stops and larger targets, so each trade’s costs are a smaller fraction of the reward. They also take fewer trades. That makes it easier for a planned ratio to survive costs intact.
The trade-off is that wider stops mean smaller position sizes for the same risk, and overnight or weekend gaps can cause stops to fill worse than planned. Neither style is simply better. The right ratio is one that’s realistic for the way you trade.
Risk Reward Ratio in Forex, Stocks, Crypto, and Gold
One of the nice features of the risk reward ratio is that it’s market-neutral. The math is identical across markets, measured in price distance. Whether you trade currency pairs, shares, crypto, or gold, you calculate risk as entry minus stop and reward as target minus entry.
What changes is the environment in which the ratio plays out.
Forex
In forex, distances are often counted in pips. If you buy EUR/USD with a 20-pip stop and a 60-pip target, the ratio is 60 ÷ 20 = 3, or 1:3. The calculation is the same as any other market, only the unit differs.
Practical considerations include:
- Spreads can widen during news releases or quiet hours, which raises the effective cost.
- Leverage is common, which magnifies both gains and losses. A good ratio doesn’t make high leverage safe.
- Stops can slip around major economic announcements.
Stocks
Stock traders measure distance in dollars or cents per share. Spreads on liquid stocks are usually small, but gaps are an important issue. A stock can close at one price and open the next day far away from it, after earnings or news. If that gap jumps over your stop, you may exit at a worse price than planned, and your realized loss will exceed your planned risk.
Crypto
Crypto trades around the clock, with no scheduled closes. Volatility is often higher than in large-cap stocks or major currency pairs, which can allow larger moves in your favor but also faster, deeper moves against you.
A hypothetical example of stop slippage: you buy at 100 with a stop at 95 and a target at 115, planning a 1:3 trade. In a fast move, your stop fills at 93. Your actual loss is 7, not 5, which is 1.4R rather than the planned 1R. If this happens repeatedly, your realized ratio is worse than planned. Thin liquidity on smaller tokens makes this more likely.
Gold Trading and High Risk Reward Strategies
A high risk reward ratio gold trading strategy is a common search, and gold is a good example of why the ratio needs context.
Gold can move quite far in a single session, especially around economic data and central bank news. That volatility can allow wide targets, which suits higher ratios. But it also means price can sweep through a stop quickly, often wider than you expect.
Consider a hypothetical gold trade, with the price at 2,000.00:
- Entry: 2,000.00
- Stop: 1,994.00 (risk 6.00)
- Target: 2,018.00 (reward 18.00)
- Planned ratio: 18 ÷ 6 = 3, so 1:3
Now add a hypothetical round-trip spread cost of 0.30:
- Loss at the stop: 6.00 + 0.30 = 6.30
- Gain at the target: 18.00 − 0.30 = 17.70
- Effective ratio: 17.70 ÷ 6.30 ≈ 1:2.8
The ratio slips slightly, which is acceptable here because the stop is wide. If the stop were tight, the effect would be larger. Slippage on top of the spread could make it worse again.
A few points matter for any high-ratio gold approach:
- Size the stop to the market’s actual volatility, not to a number that makes the ratio look appealing. A stop that sits inside normal gold swings will be hit often.
- Account for spreads and slippage, particularly around news.
- Make sure the target is plausible. A 1:5 target that gold rarely reaches in your holding period will drag the win rate down.
- Remember that high ratios usually mean lower win rates, so expect losing streaks and size positions accordingly.
None of this is a trading signal. It’s an illustration of how to think about a high ratio on a volatile instrument.
Risk Reward Ratio Indicators and Tools on MT4, MT5, and TradingView
Many traders want the platform to draw and calculate the ratio automatically. Searches like risk reward ratio MT5, risk reward ratio indicator MT5, and risk reward ratio TradingView are common. Here is how to think about the options.
Built-In Tools
Many charting platforms include a position or risk/reward drawing tool. Typically, you place it on the chart, set the entry, stop, and target levels, and the tool shows the distances and prints the ratio. Some also take account size and risk percentage and display a suggested position size.
TradingView is known for including drawing tools of this type, and MetaTrader platforms offer chart objects and order tools that let you see and manage stop and target levels, including through their order windows.
Menu names, icons, and paths change between versions and platforms. I’m intentionally not giving specific click paths, because they can be outdated. Check your platform’s documentation or search its tool menu for terms like “position,” “risk,” “reward,” or “long/short position.” If you’re looking for a risk reward ratio tool for MT4 or MT5, begin with what’s built in, since it may already do what you need.
Custom Indicators for MT4 and MT5
MetaTrader 4 and MetaTrader 5 both support custom indicators, which are small program files that add features to the chart. Custom indicator files for MetaTrader are often distributed through the MQL5 ecosystem, the community and marketplace connected with the platform.
A custom risk reward ratio indicator for MT4 or MT5 generally does things like:
- Draws entry, stop loss, and take profit lines on the chart
- Calculates and displays the risk reward ratio
- Shows potential profit and loss in money terms
- Sometimes suggests a position size based on a risk percentage
Details vary widely between tools, and quality varies too. If you use one, test it on a demo account first and verify its output against your own manual calculation from Section 3. If the numbers don’t match, don’t trust it.
A Safety Note on “Free Download” Indicator Files
Searches for a free risk reward ratio indicator for MT5, or a risk reward ratio indicator MT5 free download, lead to many sites offering files. This deserves a clear warning.
Custom indicator and expert advisor files from unofficial sources are a recognized malware and scam risk. A file that runs inside your trading platform may be able to do more than draw lines, and a malicious one can cause real damage, including on a platform connected to a funded account.
Protect yourself:
- Only use files from official, well-established sources. Be cautious with random forums, file-sharing links, and unfamiliar sites.
- Be wary of anything promising guaranteed results. An indicator that claims to guarantee profits or “never lose” is a red flag. No tool can promise that.
- Avoid files that ask for unusual permissions or your login details.
- Test on a demo account with no real funds connected, before anything else.
- Keep your security software and platform updated.
For a simple risk reward ratio calculation, you don’t actually need a downloaded file. The built-in tool or ten seconds of arithmetic does the same job without the risk. This article doesn’t recommend any specific download, seller, or broker.
How to Improve Your Risk Reward Ratio in Practice
Improving your ratio doesn’t mean shoving your target further away. It means placing stops and targets more intelligently.
Place Stops at Logical Invalidation Points
A good stop sits where your trade idea is proven wrong, usually just beyond a structural level, such as below a recent swing low for a long trade or above a recent swing high for a short.
The mistake is choosing an arbitrary stop distance, such as “a tight 5 points,” because it makes the ratio look good. If the stop sits inside normal price noise, it will trigger often, and your win rate will fall. A small stop that is hit constantly isn’t a good ratio. It’s a leaky one.
Consider adding a little buffer beyond the structural level to account for spread and brief spikes.
Place Targets at Realistic Levels
Targets are best placed at levels where the market has a plausible reason to stall, such as the next significant support or resistance zone, a prior swing high or low, or a well-watched round number.
If the nearest realistic target gives you a ratio you’re not happy with, the answer is usually to pass on the trade, not to stretch the target into empty space.
Use Partial Exits and Trailing Stops
Two techniques can reshape the outcome of a trade.
Partial exits mean closing part of the position at a first target and leaving the rest to run. Take this hypothetical example:
- Entry 100, stop 95, final target 115
- Close half at 110 (a gain of 10 per unit, 2R on that half)
- Move the stop on the remainder to breakeven (100)
- Let the remainder run to 115 (a gain of 15 per unit, 3R on that half)
If both parts reach their targets, the blended gain is (10 + 15) ÷ 2 = 12.5 per unit, which is 12.5 ÷ 5 = 1:2.5 on the full position.
If price hits 110 and then falls back to breakeven, you’ve banked half the position at 10 per unit and exited the rest at 100 for zero. The result is 10 ÷ 2 = 5 per unit, which is +1R (before costs), instead of a loss.
The trade-off is that partial exits reduce the maximum gain on a runner and can lower your total if price goes straight to the final target. They trade some upside for a smoother equity curve. Whether that’s worth it depends on your strategy and psychology.
Trailing stops move the stop in your favor as price advances, locking in some profit. They can let winners run while limiting give-back. The downside is that a trailing stop that’s too tight will get triggered by normal pullbacks, ending the trade early. Trailing methods and distances should be tested, not guessed.
Track Planned Versus Actual Ratio in a Journal
The most underrated habit is keeping a trading journal that records, for every trade:
- The planned entry, stop, and target
- The planned risk reward ratio
- The actual exit and the realized ratio (in R multiples)
- Costs paid
- Notes on why the result differed from the plan
Over time, this reveals patterns. You might discover that your average planned ratio is 1:2.5 but your average realized ratio is 1:1.4, because you often exit early, or that slippage is eating more than you thought. You can’t fix what you don’t measure.
Risk Reward Ratio and Position Sizing
The ratio describes the shape of a trade. Position sizing determines the amount at stake. Both matter, and a good ratio with an oversized position can still cause damaging losses.
Think of it this way: a 1:3 ratio on a trade that risks 20% of your account is still a trade that risks 20% of your account. If it hits the stop, you’ve taken a huge loss, and the nice ratio doesn’t give any of it back.
Risk Per Trade
Many traders choose a fixed, small percentage of their account to risk on each trade. The right figure depends on the individual, their strategy, and their tolerance for drawdown, and this article doesn’t recommend a particular number. A smaller percentage makes losing streaks easier to survive.
The Position Sizing Formula
Position size = (account size × risk percentage) ÷ stop distance per unit
Worked Example
All numbers are hypothetical.
- Account size: 10,000
- Risk per trade: 1%
- Amount at risk: 10,000 × 0.01 = 100
- Entry: 50.00
- Stop: 48.00
- Stop distance per share: 50.00 − 48.00 = 2.00
Position size = 100 ÷ 2.00 = 50 shares
If the stop is hit, the loss is 50 × 2.00 = 100, which is 1% of the account (ignoring costs and slippage).
Now set a target at 56.00:
- Reward per share: 56.00 − 50.00 = 6.00
- Ratio: 6.00 ÷ 2.00 = 3, so 1:3
- Gain at target: 50 × 6.00 = 300
So you risk 100 to gain 300, and the amount at risk was set by the position size, not by hope.
Why This Matters
Notice what happens if you widen the stop. With a stop at 46.00, the stop distance becomes 4.00, and the same 100 risk gives a position size of 25 shares. A wider stop means a smaller position. The risk in money stays fixed, and the size adjusts.
This is the correct relationship: let the stop distance determine the position size, not the other way around. Many traders get this backward, picking a size they like and then placing the stop wherever it fits their comfort zone, which can leave the stop at an illogical place.
Drawdown and Survival
Even a profitable strategy has losing streaks. With a low win rate, they can be long. Sizing positions so that a bad run doesn’t cause a damaging drawdown is what keeps you in the game long enough for expectancy to work.
Common Mistakes
Most trouble with the risk to reward ratio traces back to a few repeated errors.
Choosing a Target Only to Hit a Desired Ratio
This is the most common error. A trader decides they want 1:3, so they put the target three times the stop distance away, whether or not the market has any reason to go there. The ratio looks perfect on paper and the win rate quietly collapses. Targets should come from the chart, and the ratio should be the result, not the other way around.
Ignoring Win Rate and Expectancy
A ratio without a win rate is half a thought. As Section 5 showed, a 1:3 ratio with a 20% win rate loses money. Always ask what win rate your setup actually achieves and what the expectancy is.
Moving the Stop Further Away Mid-Trade
Widening a stop after entry because “it’ll come back” is one of the fastest ways to wreck a ratio. If you move a stop from 5 points to 10 points away on a trade with a 15-point target, the ratio quietly drops from 1:3 to 1:1.5 and the potential loss doubles. Decide your stop before you enter, and don’t move it further away. (Moving a stop in your favor, as with a trailing stop, is a different thing.)
Forgetting Spreads, Commissions, and Slippage
As the examples in Sections 4, 8, and 9 showed, costs shrink the real ratio, sometimes dramatically on short-term trades. Always work with the effective ratio after costs.
Treating the Ratio as a Guarantee
A 1:3 ratio doesn’t mean you’ll make 3 for every 1 you risk. It means that if the target is reached, the gain would be about three times the loss at the stop. Many trades never reach the target. The ratio describes the plan, not the outcome.
Skipping Position Sizing
A great ratio with an oversized position can still hurt you badly. Ratio and sizing work together.
Changing the Plan Because of Emotion
Closing winners early out of fear while letting losers run out of hope is a common pattern that wrecks the realized ratio. A journal makes this visible, and a written plan makes it easier to resist.
Comparing Ratios Across Sources Without Checking the Notation
As explained in Section 3, some sources write reward to risk and some risk to reward. Comparing a “2:1” from one site and a “1:2” from another without checking the direction can lead to real confusion.
Risks and Limitations
The ratio is useful, but it has real limits. Knowing them is part of using it responsibly.
The ratio is a plan, not an outcome. It describes what you intend, based on your entry, stop, and target. The market decides what actually happens.
Stops can fill worse than planned. During gaps, fast markets, news releases, and thin liquidity, your stop may be executed at a price well beyond your stop level. A trade planned at 1R risk can produce a loss of more than 1R.
No ratio guarantees profitability. The ratio only works in combination with win rate, costs, and discipline. A strategy with a poor win rate can lose money at any ratio.
Win rates and expectancy are estimates. Your historical numbers come from a limited sample and may not hold in the future. Markets change.
Targets are not promises. A target is a reasoned guess at where price might go, not a prediction.
Leveraged products magnify risk. Margin trading, futures, options, and leveraged forex or crypto products can produce losses larger than expected, and in some cases larger than your deposit. Understand the instrument before you trade it.
Costs vary and can change. Spreads, commissions, and financing charges differ by broker and market conditions. Verify the current figures with your own broker.
Disclaimer
This article is for educational purposes only and does not constitute financial, investment, or trading advice. Nothing here is a recommendation to buy, sell, or hold any security, currency, cryptocurrency, commodity, or derivative. All prices, trades, and results shown are hypothetical examples. Trading and investing carry a risk of loss, including the loss of your entire investment. Past performance does not guarantee future results. Always do your own research, consider your own financial situation and risk tolerance, and consult a qualified financial professional before making decisions.
Frequently Asked Questions
Is a 1:1 risk reward ratio good?
It can be, but it’s demanding. At 1:1, the breakeven win rate is 50% before costs, and costs push it higher. That means you’d need to win more than half your trades just to come out ahead. Some high-win-rate strategies can make this work, but many traders prefer ratios of at least 1:2 to give themselves more room for error. Whether 1:1 is “good” depends on whether your actual win rate, after costs, is comfortably above 50%.
Can you be profitable with a ratio below 1:1?
Yes, but it requires a high win rate. If you risk 2 to make 1, that’s a 1:0.5 ratio in this article’s notation, and the breakeven win rate is 1 ÷ (1 + 0.5) = 66.7%. A strategy that wins, say, 75% of the time could be profitable at that ratio, but a few losses can erase many wins, so it carries its own risks. Be careful, and make sure the win rate is real and measured over a meaningful sample.
What win rate do I need for a 1:2 ratio?
You need to win at least 33.3% of your trades to break even, before costs. To make a profit, you need a higher win rate than that. Because costs raise the real breakeven, many traders aim for a margin above it.
What win rate do I need for a 1:3 ratio?
The breakeven win rate for 1:3 is 25% before costs. Again, you need to exceed it to profit, and costs push the figure up.
Should I always use the same ratio?
Not necessarily. The right ratio depends on the setup, the market, and the realistic distance to the next meaningful level. Some traders set a minimum (for example, they won’t take trades below a certain ratio) and let the ratio vary above it. Forcing every trade into the same ratio can push you toward arbitrary targets or stops, which usually does more harm than good.
Does risk reward ratio matter more than win rate?
Neither matters more on its own. They work together, and expectancy combines them. A high ratio with a poor win rate can lose money, and a high win rate with a poor ratio can lose money too. The question is whether the combination produces a positive expectancy after costs.
Is a higher risk reward ratio always better?
No. A higher ratio lowers the breakeven win rate, but it usually requires a more distant target, which price reaches less often. If the win rate falls faster than the breakeven falls, expectancy gets worse. A higher ratio is only better if the target remains realistic.
How do I calculate the risk reward ratio quickly?
Subtract the stop from the entry to get risk, subtract the entry from the target to get reward, and divide reward by risk. If the result is 3, the ratio is 1:3. Most platforms with a position or risk/reward drawing tool will do this for you, but it’s worth knowing how to do it by hand so you can check the tool’s output.
Do I need a risk reward ratio indicator for MT4, MT5, or TradingView?
You don’t need one, because the calculation is simple and many platforms include a built-in tool. If you choose to use a custom indicator, get it from an official, well-established source, verify its output against your own calculation, and test it on a demo account first. Be cautious with free downloads from unfamiliar sites.
Conclusion
The risk reward ratio is one of the simplest ideas in trading and one of the most misunderstood. It compares what you could lose with what you could gain, it’s set before you enter a trade, and it follows directly from three prices: your entry, your stop loss, and your take profit.
But the ratio only means something alongside the other two pieces. Win rate tells you how often the target is reached, and the breakeven formula, 1 ÷ (1 + R), shows how the two connect. Expectancy combines them into one number. Position sizing decides how much money rides on each outcome. Skip any of the three and the ratio can mislead you, whether you’re trading forex, stocks, crypto, or gold.
Remember the practical habits too. Place stops at logical invalidation points. Place targets at realistic levels. Measure the ratio after spreads and slippage. Keep a journal that compares the planned ratio with the realized one. And treat every ratio as a plan, not a promise.
If you’d like to put this into practice, take your last ten trades, or ten setups from a chart, and calculate the planned risk reward ratio, the realized ratio, and your expectancy. The gap between planned and actual is often the most valuable lesson. Then test any change on a demo account before risking real money.
Educational content only, not financial advice. Trading involves risk, including the potential loss of capital.