Disclaimer: This article is for educational purposes only and does not constitute financial, investment, or trading advice. Trading involves substantial risk, including the risk of losing your invested capital. Always do your own research and consult a qualified professional before trading.
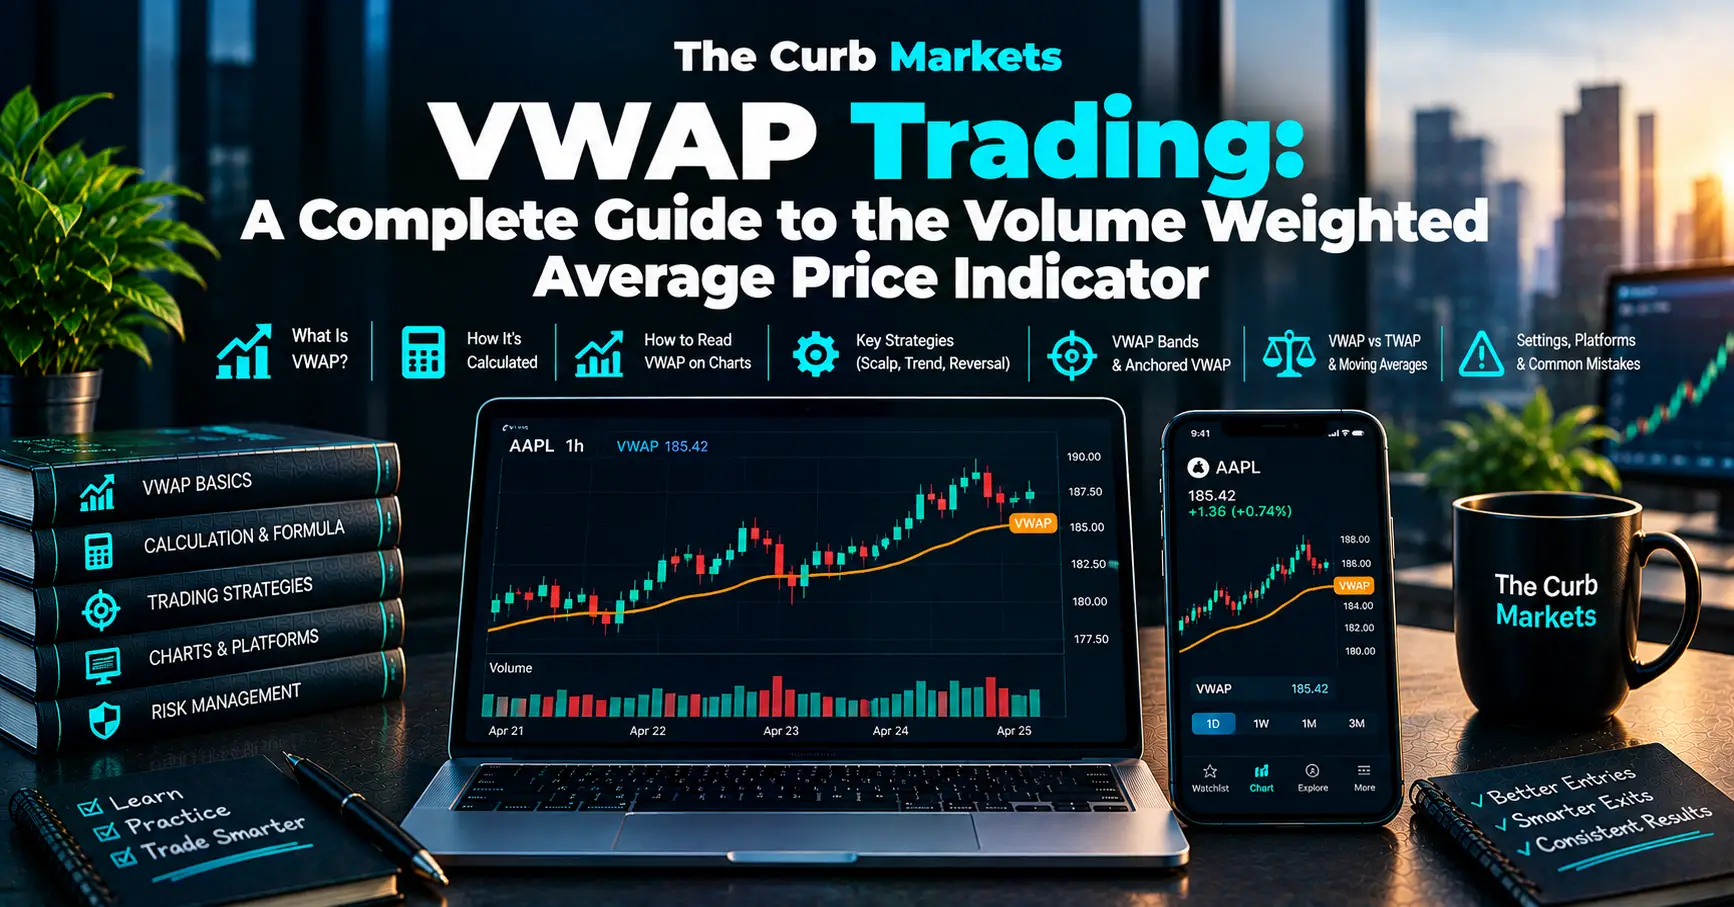
Open almost any intraday chart on a trading platform and you will likely see a smooth line weaving through the candles, often orange or purple, that traders watch almost as closely as price itself. That line is VWAP, short for volume weighted average price, and it is one of the most widely used indicators among day traders, institutional desks, and algorithmic trading systems alike.
Unlike many indicators that only look at price, VWAP blends price and volume together, which gives it a unique ability to show where the real weight of trading activity has occurred during a session. Institutions use it to measure whether their large orders were executed at a fair price. Day traders use it to judge whether the market is leaning bullish or bearish, and to find logical entry and exit points. Even casual investors sometimes glance at VWAP to get a quick read on whether a stock is trading above or below its session average.
This guide explains everything a trader needs to know about VWAP. You will learn what VWAP is and what it stands for, the exact formula behind it and how it is calculated, how to read it on a live chart, how to use it for day trading, several practical VWAP trading strategies, what VWAP bands are, what anchored VWAP means and how it differs from standard VWAP, how VWAP compares with TWAP and with moving averages, the best VWAP settings many traders use, and how to apply VWAP on platforms such as TradingView and MetaTrader 5. You will also find honest answers to common questions, along with the mistakes and limitations every trader should understand before relying on this tool.
1. WHAT IS VWAP IN TRADING?
VWAP, or volume weighted average price, is a trading indicator that calculates the average price a security has traded at over a given session, with each price weighted by the volume traded at that price. In simple terms, instead of treating every price during the day equally, VWAP gives more influence to the prices where the most buying and selling actually happened, and less influence to prices where only a small amount of trading occurred.
This matters because a simple average price, calculated by just adding up prices and dividing by the number of data points, can be misleading. Imagine a stock that spends most of the day trading around 100 dollars with heavy volume, but briefly spikes to 110 dollars on very light volume for a few minutes. A basic average would let that brief spike pull the number upward more than it deserves. VWAP corrects for this by weighting each price according to how much volume traded there, so the 100 dollar level, where the real activity happened, dominates the calculation, while the thinly traded spike barely moves the needle.
VWAP typically resets at the start of each new trading session and accumulates throughout the day, which is why it is often described as an intraday indicator. By the close of the session, VWAP reflects a volume weighted summary of the entire day’s trading, making it a useful benchmark for judging whether any single trade during that session happened at a relatively good or relatively poor price compared to the broader market activity.
Who actually uses VWAP
VWAP was originally developed as an institutional benchmark. Large funds and institutional trading desks often need to buy or sell enormous quantities of a security without disturbing the price too much. By comparing their average execution price against the day’s VWAP, they can judge how efficiently their trades were carried out. If a large buyer manages to acquire shares at a price below VWAP, that is generally considered a favorable execution, since it means they bought below the volume weighted average for the day.
Over time, retail day traders and technical analysts adopted VWAP for a different purpose: using it as a dynamic support and resistance level, and as a quick visual gauge of intraday sentiment. Today, VWAP appears by default on most major charting platforms, and it has become one of the standard tools taught to new day traders, alongside moving averages and basic candlestick patterns.
2. WHAT DOES VWAP STAND FOR?
VWAP stands for Volume Weighted Average Price. Breaking the phrase down word by word makes the concept easier to remember.
Volume refers to the number of shares, contracts, or units of a security traded during a given period. Weighted means that each price point in the calculation is given importance in proportion to how much volume occurred at that price, rather than being treated equally. Average Price refers to the resulting single value that summarizes where the asset has traded, once that volume weighting has been applied.
Put together, VWAP answers a very specific question: considering everything that has traded so far today, and giving more weight to the price levels where the heaviest trading occurred, what is the single number that best represents today’s average trading price?
This is different from a simple price average, and it is also different from the closing price of a candle, which only reflects the price at the very end of a time interval regardless of how much volume occurred there. VWAP is a cumulative, volume sensitive measurement that updates continuously as the session progresses, which is part of why traders find it so useful for gauging real time sentiment rather than relying on a single static number.
3. THE VWAP FORMULA AND HOW VWAP IS CALCULATED
Understanding how VWAP is calculated removes much of the mystery around the indicator and helps explain why it behaves the way it does on a chart.
The typical price
The first building block of the VWAP formula is the typical price for a given interval, such as one minute or five minutes. The typical price is calculated as the average of the high, low, and closing price for that interval.
Typical Price equals the High price plus the Low price plus the Close price, all divided by three.
Some platforms use a slightly different source for this calculation, such as the average of just the high and low, but the high, low, close average is the most common approach used across major charting tools.
The core VWAP formula
Once the typical price for each interval is known, it is multiplied by the volume traded during that same interval. This running total is then divided by the cumulative volume traded since the session began.
VWAP equals the cumulative sum of Typical Price multiplied by Volume, for every interval since the session opened, divided by the cumulative sum of Volume over that same period.
Step by step calculation
To calculate VWAP manually, a trader would follow this sequence for each interval throughout the session. First, calculate the typical price for the interval using the high, low, and close. Second, multiply that typical price by the volume traded during the interval. Third, add this result to a running cumulative total of typical price multiplied by volume. Fourth, add the interval’s volume to a running cumulative total of volume. Fifth, divide the cumulative total of typical price multiplied by volume by the cumulative total of volume, which produces the current VWAP value. This process repeats at every new interval, which is why the VWAP line continuously updates and smooths out as the day progresses.
A simple numerical example
Suppose a stock trades during its first three one minute intervals of the day as follows. In interval one, the typical price is 50 dollars and the volume is 1,000 shares. In interval two, the typical price is 51 dollars and the volume is 2,000 shares. In interval three, the typical price is 49 dollars and the volume is 500 shares.
The cumulative total of typical price multiplied by volume would be 50,000 plus 102,000 plus 24,500, which equals 176,500. The cumulative volume would be 1,000 plus 2,000 plus 500, which equals 3,500 shares. Dividing 176,500 by 3,500 produces a VWAP of exactly 50.43 dollars, rounded to two decimal places.
Notice that this VWAP value sits closer to 51 dollars than to 49 dollars, even though both prices are roughly equidistant from 50. That happens because interval two, priced at 51 dollars, carried far more volume than interval three, priced at 49 dollars, so it pulled the weighted average upward. This small example illustrates exactly why VWAP reflects where the heaviest trading activity actually occurred, rather than simply averaging prices without regard to volume.
Why VWAP resets daily
Most charting platforms reset the standard VWAP calculation at the start of each new trading session, beginning the cumulative totals fresh each day. This daily reset is intentional, since VWAP is meant to represent that specific session’s volume weighted average, allowing traders to compare the current day’s price action against a clean, session specific benchmark rather than one blended across multiple days.
4. HOW TO READ A VWAP INDICATOR ON A CHART
Once VWAP is plotted on a chart, interpreting it becomes fairly intuitive, especially once you understand the handful of core reading patterns traders rely on.
Price relative to the VWAP line
The most basic reading of VWAP is simply whether the current price is trading above or below the line. When price trades above VWAP, it generally suggests that buyers have had the upper hand so far during the session, since the market has been willing to pay above the volume weighted average. When price trades below VWAP, it generally suggests sellers have had more control, since the market has been trading beneath the average price paid so far.
Some traders use this basic read as a simple bias filter, favoring long trades only while price holds above VWAP, and favoring short trades only while price holds below it, treating the line as a dividing boundary between bullish and bearish control for that session.
VWAP as dynamic support and resistance
Because VWAP continuously updates and often acts as a magnet that price gravitates toward and bounces from, many traders treat it similarly to a moving average, watching for price to test the VWAP line and either bounce away from it or break through it. A bounce off VWAP during an uptrend is sometimes used as a potential entry point for a long trade, while a clean break below VWAP during that same uptrend can signal weakening momentum.
The slope of VWAP
Beyond price’s position relative to VWAP, the angle or slope of the VWAP line itself carries information. A steadily rising VWAP suggests sustained buying pressure throughout the session, while a steadily falling VWAP suggests sustained selling pressure. A relatively flat VWAP often indicates a session without a strong directional bias, where price is chopping sideways around the average.
Distance from VWAP
The distance between the current price and the VWAP line also matters. A price that has moved far above or far below VWAP is sometimes considered stretched, and some traders watch for a reversion back toward the line after such an extended move, particularly in range bound markets. In a strongly trending market, however, price can remain extended away from VWAP for a sustained period, so this reading should never be used in isolation.
Combining VWAP with price action and volume
Experienced traders rarely read VWAP by itself. They combine it with candlestick patterns, support and resistance levels, and volume spikes to build a fuller picture. For example, a bounce off VWAP that coincides with a clear bullish candlestick pattern and a noticeable increase in volume carries more weight than a bounce with no such confirmation.
5. HOW TO USE VWAP IN TRADING
VWAP serves several distinct purposes depending on who is using it and why, and understanding these different applications helps explain why the indicator is so widely adopted across very different types of market participants.
As a benchmark for trade execution quality
Institutional traders and fund managers often use VWAP to evaluate how well a large order was executed. If a trader needed to buy a large position and their average purchase price ended up below the day’s VWAP, that execution is generally considered favorable, since it means they acquired shares at a better than average price relative to the rest of the market’s activity that day. This use case is less relevant to most retail traders, but it explains why VWAP carries real institutional weight and why large algorithmic trading systems are specifically designed to execute big orders as close to VWAP as possible, a strategy often referred to as a VWAP execution algorithm.
As a gauge of intraday sentiment
For day traders, VWAP offers a quick visual answer to a simple but important question: is today’s session, on balance, leaning bullish or bearish. Because the line reflects the volume weighted average of all trading so far, its position relative to current price offers an instant sentiment check without needing to analyze the entire session’s price history manually.
As a dynamic trade level
Many traders use VWAP as a reference level for planning entries, exits, and stop losses. A long trader might look for pullbacks toward VWAP as a potential entry point during an uptrend, using a stop loss placed just below the line. A short trader might look for similar rallies up toward VWAP during a downtrend as a potential shorting opportunity.
As a filter for trade direction
Some trading systems use VWAP purely as a directional filter, only allowing long trades to be considered while price remains above VWAP, and only allowing short trades to be considered while price remains below it. This simple rule helps keep a trader aligned with the dominant intraday bias rather than fighting against it.
As a tool for identifying fair value
Beyond specific trade setups, VWAP gives traders a general sense of fair value for the session. A price far above VWAP might be viewed as relatively expensive compared to where most of the day’s volume has traded, while a price far below VWAP might be viewed as relatively cheap, within the context of that session’s activity.
6. HOW TO USE VWAP FOR DAY TRADING
Day trading is where VWAP sees its heaviest use among retail traders, largely because the indicator is specifically designed around a single trading session, making it naturally suited to strategies built around intraday price movement.
Starting the day with VWAP in view
Most day traders keep VWAP visible on their chart from the market open onward. In the first few minutes of trading, VWAP tends to track very closely with price, since there is limited cumulative volume to smooth it out yet. As the session progresses and volume accumulates, VWAP becomes a more stable, meaningful reference line.
Using VWAP to confirm trend direction
A common day trading approach involves checking whether price opened above or below the previous session’s closing VWAP level, and then watching how price behaves relative to the current day’s developing VWAP line throughout the morning session. Sustained trading above VWAP throughout the morning often suggests a trader should favor long setups, while sustained trading below VWAP suggests favoring short setups, at least until the picture changes.
Combining VWAP with opening range analysis
Many day traders combine VWAP with an analysis of the opening trading range, the high and low established in the first several minutes after the market opens. If price breaks above the opening range and also trades above VWAP, this combination is often viewed as a stronger bullish signal than either condition alone. The same logic applies in reverse for bearish setups.
Watching for VWAP reclaim and rejection patterns
A VWAP reclaim occurs when price, after trading below the line for a period, pushes back above it and holds there, which some traders view as an early sign of a shift toward bullish control. A VWAP rejection occurs when price attempts to push above the line but quickly fails and falls back below it, which some traders view as a sign that sellers are still in control. These patterns are typically combined with volume and candlestick confirmation rather than traded on their own.
Managing risk around VWAP based day trades
Because day trading already involves fast moving price action and tight timeframes, risk management becomes especially important when building strategies around VWAP. Many day traders place stop losses a small, defined distance beyond the VWAP line itself, so that if the thesis behind the trade is proven wrong by price decisively breaking through VWAP in the opposite direction, the position is closed automatically with a limited, predetermined loss.
7. VWAP TRADING STRATEGIES
There is no single official VWAP trading strategy. Instead, traders have developed several distinct approaches that use the indicator in different ways, often combining it with other tools for confirmation.
The VWAP trend following strategy
This approach treats VWAP as a simple directional filter. The trader only looks for long entries while price remains consistently above VWAP, and only looks for short entries while price remains consistently below it. Entries are typically triggered by a pullback toward the VWAP line followed by a resumption of the prevailing direction, often confirmed with a bullish or bearish candlestick pattern at the point of the pullback.
The VWAP bounce strategy
Here, a trader watches for price to approach the VWAP line after moving away from it earlier in the session, anticipating that the line will act as support in an uptrend or resistance in a downtrend. A clean bounce off the line, especially one accompanied by increasing volume, is used as a trade trigger, with a stop loss placed just beyond the line on the opposite side.
The VWAP breakout and reclaim strategy
This strategy focuses specifically on the moments when price crosses through VWAP rather than bouncing off it. A decisive, high volume break above VWAP after a period of trading below it can signal a potential shift toward bullish momentum, while a decisive break below VWAP after trading above it can signal a shift toward bearish momentum. Traders using this approach often wait for a candle to close clearly on one side of VWAP, rather than reacting to a brief, low volume touch of the line, to avoid being caught in a false signal.
The mean reversion strategy around VWAP
In range bound or choppy markets, some traders use VWAP as a center point for mean reversion trades, looking to fade extended moves away from the line and anticipate a return back toward it. This strategy tends to work best in markets without a strong directional trend, and it typically performs poorly during strongly trending sessions, where price can remain extended away from VWAP for long stretches without reverting.
Combining VWAP with other indicators
Many traders avoid relying on VWAP in isolation and instead combine it with tools such as moving averages, the relative strength index, or basic volume analysis to add confirmation before entering a trade. For example, a trader might only take a VWAP bounce trade if the relative strength index also suggests the move is not already overextended, adding an additional layer of confirmation beyond price and VWAP alone.
Scalping around VWAP
Some very short term traders use small, quick trades around VWAP touches, aiming to capture brief moves as price interacts with the line throughout the day. This approach requires fast execution, tight risk control, and significant screen time, and it is generally better suited to experienced traders than to beginners, given how quickly conditions can change on very short timeframes.
8. VWAP BANDS EXPLAINED
VWAP bands are an extension of the standard VWAP indicator, adding upper and lower lines plotted at a certain statistical distance above and below the core VWAP line, similar in concept to how Bollinger Bands are built around a moving average.
What VWAP bands measure
These bands are typically calculated using the standard deviation of price from the VWAP line, meaning they expand when price becomes more volatile relative to VWAP, and contract when price trades in a tighter range around it. Most platforms allow traders to display one, two, or more sets of bands, often set at one standard deviation and two standard deviations away from the core VWAP line.
How traders use VWAP bands
The bands give traders a visual sense of how far price has stretched away from the volume weighted average, which can help identify potentially overextended conditions. When price pushes out to the outer bands, some traders view this as a signal that the current move may be stretched and due for either a pause or a reversion back toward the VWAP line, particularly in markets without strong trending conditions.
Conversely, in a strongly trending market, price can ride along an outer band for an extended period, which some trend following traders interpret as a sign of unusually strong momentum rather than an overextension warning. This is why VWAP bands, like the core VWAP line itself, tend to work best when combined with an understanding of the broader market context rather than being used as a standalone signal.
Setting up VWAP bands
Most major charting platforms that include a VWAP indicator also offer a built in option to display bands, usually adjustable to show one or more standard deviation levels. Traders experimenting with this tool often start with the default settings before adjusting the specific standard deviation multiples to better fit the volatility of whatever security they are trading.
9. ANCHORED VWAP AND THE WORK OF BRIAN SHANNON
Anchored VWAP is a variation of the standard VWAP indicator that has become extremely popular among technical traders, and understanding it requires understanding how it differs from the standard, session based version.
What anchored VWAP is
Standard VWAP automatically resets at the beginning of each new trading session, always measuring from that day’s open onward. Anchored VWAP, by contrast, allows a trader to manually choose a specific starting point, or anchor, from which the volume weighted average price calculation begins, and that calculation then continues forward from that chosen point without resetting daily.
This anchor point is usually chosen because it represents a moment of real significance for the security being analyzed, such as a major earnings announcement, a significant news event, a notable swing high or swing low, the start of a new calendar year, or any other point a trader believes marks an important shift in the stock’s story. By anchoring VWAP to that specific moment, the indicator then shows the volume weighted average price of everyone who has traded the security since that point, which can offer insight into where the overall market participants from that period, on average, currently stand.
Why anchored VWAP matters
Anchored VWAP is particularly useful because it extends beyond a single session, allowing traders to analyze price relative to a meaningful average across days, weeks, or even months, rather than being limited to the restart that standard VWAP undergoes every single day. This makes it a popular tool not just for day traders, but also for swing traders and longer term technical analysts who want a volume weighted reference point tied to a specific, meaningful event rather than an arbitrary calendar reset.
The contribution of Brian Shannon
Brian Shannon, a trader and technical analyst, is widely credited within the trading community for developing and popularizing the anchored VWAP concept, building on the original institutional VWAP indicator and extending it into a flexible tool traders could anchor to any meaningful point on a chart rather than only the start of a session. His work and teaching have played a significant role in bringing anchored VWAP into mainstream use among both professional and retail technical traders, and many modern charting platforms now include a built in anchored VWAP tool specifically because of how widely his approach has been adopted across the trading community.
Traders interested in a deeper, more formal treatment of anchored VWAP and its underlying philosophy are encouraged to explore Brian Shannon’s own published material directly, since this guide can only summarize the general concept rather than reproduce his complete teaching.
Common ways traders anchor VWAP
Popular anchor points include the opening print of a new calendar year, used by some traders to gauge how the average participant across the entire year is positioned. The date of a major earnings report, used to see how the stock has performed, on a volume weighted basis, since that announcement. A significant swing high or swing low, used to analyze price relative to the average cost basis of traders who have participated since that turning point. The start of a new trend, identified after the fact, used to analyze how the move has developed on a volume weighted basis since it began.
Reading anchored VWAP on a chart
Interpretation follows similar logic to standard VWAP. Price trading above an anchored VWAP line generally suggests that, on a volume weighted basis, participants since that anchor point are sitting on unrealized gains, while price below the line suggests the opposite. Because the anchor point is chosen specifically for its significance, many traders view an anchored VWAP line as carrying extra weight as a support or resistance level compared to more arbitrary price levels on the chart.
10. VWAP vs TWAP
Another indicator frequently compared with VWAP is TWAP, which stands for time weighted average price, and understanding the difference between the two highlights exactly what makes VWAP unique.
What TWAP measures
TWAP calculates the average price of a security over a chosen period purely based on time, dividing that period into equal intervals and averaging the price across those intervals without giving any special weight to how much volume traded during each one. In other words, TWAP treats every time interval as equally important, regardless of whether that interval saw heavy trading activity or almost none at all.
The key difference between VWAP and TWAP
VWAP incorporates volume directly into its calculation, giving more weight to price levels where more trading occurred. TWAP ignores volume entirely and simply averages price evenly across time. This means that during periods of unusually heavy or unusually light trading activity, VWAP and TWAP can diverge meaningfully from one another, since VWAP will be pulled toward the high volume price levels while TWAP remains unaffected by volume differences between intervals.
When each indicator is preferred
VWAP is generally preferred when a trader or institution wants their execution benchmark to reflect the market’s actual trading activity, making it the more commonly used standard among most day traders and many institutional desks. TWAP is sometimes preferred specifically in situations where a trader wants to avoid drawing attention to unusually high volume periods, spreading large orders evenly across time regardless of volume patterns, which can be useful for reducing market impact in certain institutional execution strategies, particularly in less liquid securities where sudden volume driven price swings are a bigger concern.
For the average retail day trader, VWAP remains the far more widely used and widely available indicator on most charting platforms, while TWAP tends to appear more often in institutional execution algorithms and specialized trading software rather than standard retail charting tools.
11. VWAP vs MOVING AVERAGES
Traders frequently ask how VWAP compares with more traditional moving averages, since both appear as smooth lines overlaid on price and both are used in somewhat similar ways.
The core difference
A simple moving average calculates the average closing price over a set number of periods, such as the last twenty candles, treating each of those periods equally regardless of volume. VWAP, by contrast, factors in volume at every step, giving more weight to price levels where heavier trading occurred. This means a moving average is purely price based, while VWAP is both price and volume based.
Reset behavior
Standard VWAP resets at the beginning of each new trading session, always starting fresh. A moving average does not reset daily in the same way, instead continuously rolling forward based on its fixed lookback period, which means it carries information across multiple sessions rather than restarting each day. Anchored VWAP bridges this gap somewhat, since it can be anchored to a point further back than a single session and then carried forward from there, similar in spirit to how a moving average continues across time, while still retaining VWAP’s volume weighting.
Lag characteristics
Both indicators are inherently backward looking, since they are built from past price and volume data, which means both can lag behind sudden, sharp price movements. VWAP is sometimes considered slightly more responsive within a single session, particularly early in the day, since it begins fresh at the open and has less historical data smoothing it out compared to a moving average carrying a longer lookback period.
When traders use one, the other, or both
Many traders use VWAP specifically for intraday decisions, given its session based nature and institutional relevance, while reserving longer term moving averages for assessing the broader trend across multiple days or weeks. It is common to see both indicators plotted on the same chart simultaneously, with VWAP used for intraday context and a longer moving average, such as a fifty period or two hundred period average, used to understand the bigger picture trend the stock is operating within.
12. BEST VWAP SETTINGS FOR DAY TRADING
Traders frequently search for the best VWAP settings, hoping for a single ideal configuration. In reality, VWAP’s core calculation is largely standardized across platforms, but there are still several practical settings and choices worth understanding.
Source price setting
Most platforms default to using the typical price, calculated from the high, low, and close, as the source for the VWAP calculation. Some platforms allow traders to switch to alternative sources, such as the average of just the high and low, though the high, low, close typical price remains the most widely used and generally recommended default for most traders.
Session reset settings
Standard VWAP is almost universally set to reset at the start of each new trading session by default, and most day traders keep this setting unchanged, since the entire value of session based VWAP depends on this daily reset. Traders interested in a longer term, non resetting view should use the anchored VWAP tool instead, rather than changing the reset behavior of the standard session VWAP.
Timeframe considerations
While VWAP itself is calculated using intraday volume data regardless of the chart’s displayed timeframe, many day traders view VWAP most commonly on charts ranging from one minute up to fifteen minute intervals, since this range tends to balance enough detail to see meaningful price action against enough smoothing to avoid excessive noise. Longer term swing traders interested in anchored VWAP often view it on daily charts instead.
Standard deviation bands
For traders who use VWAP bands, a common starting configuration displays one standard deviation and two standard deviation bands above and below the core VWAP line. Some traders adjust these multiples based on the typical volatility of the specific security they are trading, using tighter bands for lower volatility securities and wider bands for more volatile ones.
Combining with volume display
Many experienced VWAP users also keep a volume histogram visible beneath their price chart alongside VWAP, since unusual spikes in volume often provide important context for interpreting VWAP based signals, helping distinguish a meaningful, high conviction move through the line from a low volume, less significant touch.
A practical starting point
For a beginner, a sensible starting configuration is the default VWAP settings provided by most major charting platforms, using the standard typical price source, the standard daily session reset, and viewing it on a timeframe between one and fifteen minutes depending on personal trading style, while gradually experimenting with bands and anchored VWAP only after becoming comfortable with the core indicator’s behavior.
13. USING VWAP ON TRADINGVIEW, MT5, AND TRADING APPS
Most traders access VWAP through their charting platform rather than calculating it manually, so understanding how to find and apply it across popular platforms is genuinely useful.
VWAP on TradingView
TradingView, one of the most widely used charting platforms among retail traders, includes VWAP as a built in indicator that can be added to any chart directly from the indicators menu. Once applied, TradingView allows traders to adjust the source price, toggle standard deviation bands on or off, and choose between the standard session based VWAP and the separate anchored VWAP tool, which lets a trader click directly on the chart to set a custom anchor point rather than relying on the automatic session reset. TradingView’s popularity, combined with how actively traders share public chart analysis on the platform, has made it one of the most common places newer traders first encounter and experiment with VWAP.
VWAP on MT5
MetaTrader 5, commonly referred to as MT5, is a widely used trading platform, particularly popular among forex and certain commodity traders. Unlike TradingView, MT5 does not always include VWAP as a default built in indicator depending on the version and broker configuration, so traders on this platform often need to add a custom VWAP indicator, available through MT5’s indicator marketplace or through custom indicator files provided by brokers or third party developers. Once properly installed, a VWAP indicator on MT5 generally functions the same way as on other platforms, plotting the volume weighted average price directly on the chart based on the same underlying formula.
VWAP on trading apps and mobile platforms
Many broker provided trading apps, especially those built around stock or crypto trading, include VWAP as a selectable indicator within their charting tools, though the depth of customization available, such as adjustable bands or anchored VWAP options, varies significantly between apps. Traders who rely heavily on advanced VWAP features, such as detailed anchored VWAP analysis, often find that a dedicated charting platform like TradingView offers considerably more flexibility than a basic mobile trading app’s built in charts.
Choosing the right platform for your VWAP based approach
For traders who want to experiment with multiple anchor points, standard deviation bands, and detailed customization, a dedicated charting platform with robust indicator support is generally the better choice. For traders who simply want to see the standard session VWAP line while executing trades directly, many broker platforms and apps provide sufficient built in functionality without needing a separate charting tool.
14. HOW TO TRADE VWAP STEP BY STEP FOR BEGINNERS
If you are new to using VWAP and want a clear, structured path to start incorporating it into your trading, the following sequence offers a sensible starting point.
Step one: understand the indicator fully before trading with it
Make sure you can explain, in your own words, what VWAP measures, why volume weighting matters, and why the standard version resets daily. If any part of this still feels unclear, revisit the earlier sections of this guide before moving forward.
Step two: add VWAP to your chart and simply observe
Before placing any trades based on VWAP, spend time simply watching how it behaves across multiple trading sessions on a security you are familiar with. Notice how price interacts with the line, how the line’s slope changes throughout the day, and how it behaves differently during trending versus choppy sessions.
Step three: choose one simple strategy to start with
Rather than attempting to combine every VWAP based approach at once, select a single, well defined strategy discussed earlier in this guide, such as the trend following approach or the bounce strategy, and commit to learning that one approach thoroughly before adding complexity.
Step four: practice on a demo account or through paper trading
Apply your chosen VWAP strategy using a demo account or paper trading feature, if your platform offers one, placing simulated trades based on VWAP signals without risking real capital. Pay close attention to how often your chosen setup actually appears during a normal trading session.
Step five: define your risk management rules clearly
Before placing any real trades, decide exactly how you will set stop losses relative to VWAP, how much of your account you are willing to risk on any single trade, and under what conditions you will exit a position for a profit. Write these rules down so you can refer back to them consistently.
Step six: start with small position sizes in live trading
Once you feel confident from your practice phase, begin applying your VWAP strategy with real money, but keep your position sizes small at first. The goal in this early live trading phase is to confirm that your strategy performs similarly to how it did in practice, not to maximize profit immediately.
Step seven: keep a trading journal specific to your VWAP trades
Record each VWAP based trade, including the specific setup you used, whether it was a bounce, a breakout, a reclaim, or another pattern, along with the outcome and any observations about how price behaved around the line. Reviewing this journal regularly will help you refine your approach and recognize which specific VWAP patterns tend to work best for the securities and timeframes you trade.
Step eight: gradually expand your toolkit
Once you are comfortable and consistent with your initial strategy, consider gradually incorporating additional tools covered in this guide, such as anchored VWAP for longer term context or VWAP bands for gauging overextension, always testing new additions carefully before relying on them in live trading.
15. VWAP IN STOCKS, CRYPTO, AND OTHER MARKETS
While VWAP originated primarily as a tool for equity markets, its underlying logic, weighting price by volume, applies naturally across many different types of markets, and traders today use it well beyond stocks alone.
VWAP in stocks
Stocks remain the most common and traditional use case for VWAP, particularly for actively traded shares with significant daily volume. Both institutional execution desks and retail day traders rely heavily on VWAP across individual stocks, especially higher volume names where the indicator’s volume weighting carries the most statistical meaning.
VWAP in cryptocurrency markets
Because cryptocurrency markets trade continuously, twenty four hours a day, the concept of a single daily session reset becomes somewhat more flexible than in traditional stock markets, which close each day. Many crypto traders still use a daily VWAP reset aligned with a standard time, such as midnight UTC, treating each twenty four hour period as its own session for VWAP purposes. Anchored VWAP is particularly popular in crypto trading as well, since traders often anchor the indicator to significant events such as a major price breakout, a notable low following a sharp decline, or the start of a new calendar period, given that crypto markets lack the natural daily open and close that traditional markets provide.
VWAP in forex markets
Currency markets present a unique challenge for VWAP, since forex trading is famously decentralized, meaning there is no single, universally agreed volume figure the way there is for a centralized stock exchange. Different brokers and data providers may show different volume figures based only on their own platform’s activity, known as tick volume rather than true traded volume. As a result, VWAP in forex is generally considered a useful but imperfect proxy, and traders using it in currency markets should understand that the volume component is less comprehensive than in centralized equity or futures markets.
VWAP in futures markets
Futures markets, being centralized and exchange traded, provide volume data very similar in nature to stock markets, making VWAP a well suited and widely used tool among futures traders as well, particularly for actively traded index and commodity futures contracts.
A general takeaway across markets
Regardless of the specific market, VWAP’s usefulness depends heavily on the reliability and completeness of the underlying volume data. In markets with robust, centralized volume reporting, such as major stocks and futures, VWAP tends to be a more statistically meaningful tool. In markets with fragmented or incomplete volume reporting, such as much of the forex market, traders should treat VWAP as a helpful reference rather than a precise, fully reliable measurement.
16. COMMON MISTAKES WHEN USING VWAP
Even experienced traders can fall into certain habits that undermine the usefulness of VWAP. Beginners in particular should watch for these common mistakes.
Treating every touch of VWAP as a guaranteed signal. Price frequently crosses VWAP throughout a session without any meaningful follow through, and reacting to every single touch without additional confirmation often leads to a high number of low quality trades.
Ignoring overall market context. VWAP reflects a single session’s volume weighted activity, but it says nothing on its own about broader trend direction, upcoming news events, or overall market sentiment, all of which can override a VWAP based signal.
Using VWAP in extremely low volume securities. Because VWAP’s entire value comes from weighting price by volume, applying it to thinly traded securities, where volume is sparse and erratic, can produce a less meaningful, more easily distorted line.
Confusing standard VWAP with anchored VWAP. Beginners sometimes expect the standard, daily resetting VWAP to behave like a longer term reference level, not realizing it resets every session, which can lead to confusion when comparing price action across multiple days using the wrong version of the tool.
Over relying on VWAP bands as guaranteed reversal points. While price touching an outer VWAP band can indicate an extended move, strongly trending markets can see price ride along a band for an extended period, and treating every band touch as an automatic reversal signal can lead to repeated losing trades during strong trends.
Neglecting proper risk management. As with any indicator based strategy, failing to use clearly defined stop losses and position sizing around VWAP based trades can turn otherwise reasonable setups into significant losses when the market moves unexpectedly.
Anchoring VWAP to arbitrary or insignificant points. Anchored VWAP is most useful when anchored to a point with genuine significance, such as a major news event or an important swing high or low. Anchoring it randomly, without a clear rationale, reduces the tool’s analytical value considerably.
17. LIMITATIONS AND RISKS OF RELYING ON VWAP
No indicator, including VWAP, works perfectly in every market condition, and understanding its limitations is just as important as understanding its strengths.
VWAP is a lagging, backward looking calculation
Like most technical indicators, VWAP is built entirely from past price and volume data. It describes where trading has already occurred, not where price will necessarily go next. Traders should avoid treating VWAP as a predictive tool and instead view it as a descriptive summary of recent trading activity that can inform, but never guarantee, future decisions.
VWAP can be less meaningful during unusual sessions
During holiday shortened sessions, major news events, or periods of unusually thin trading, VWAP’s volume weighting can behave erratically, since the normal pattern of volume distribution throughout the day may be disrupted. Traders should apply extra caution when relying heavily on VWAP during these atypical conditions.
VWAP alone does not account for broader context
VWAP reflects only the current session’s, or the current anchor period’s, volume weighted activity. It does not inherently account for longer term trend direction, fundamental developments, or broader market conditions, all of which can be far more important drivers of price than a single session’s average.
No indicator eliminates trading risk
It is worth repeating clearly that VWAP, like every technical indicator, does not guarantee profitable trades. Markets remain unpredictable, and even well reasoned VWAP based setups will sometimes fail. Proper risk management, realistic expectations, and continuous learning remain far more important to long term trading outcomes than any single indicator, VWAP included.
Over automation and algorithmic competition
Because VWAP is so widely used by institutional algorithms specifically designed to execute large orders near the VWAP level, retail traders should recognize they are, in a sense, trading alongside highly sophisticated automated systems that are actively influencing price around this exact benchmark. This does not make VWAP useless for retail traders, but it is worth understanding that some of the price behavior seen around VWAP is directly driven by large scale automated execution rather than purely organic market sentiment.
18. FREQUENTLY ASKED QUESTIONS
What is VWAP in trading?
VWAP, or volume weighted average price, is a trading indicator that calculates the average price a security has traded at during a session, with each price weighted according to how much volume traded at that level, giving more influence to heavily traded prices and less influence to lightly traded ones.
What does VWAP stand for?
VWAP stands for Volume Weighted Average Price.
What is the VWAP formula?
VWAP equals the cumulative total of typical price multiplied by volume, divided by the cumulative total of volume, where typical price is calculated as the high, low, and close of each interval added together and divided by three.
How is VWAP calculated step by step?
For each interval, calculate the typical price from the high, low, and close, multiply it by that interval’s volume, add the result to a running cumulative total, do the same for cumulative volume, then divide the cumulative price times volume total by the cumulative volume total to get the current VWAP value.
How do I use VWAP in trading?
Traders commonly use VWAP as a gauge of intraday sentiment, a dynamic support or resistance level, a directional bias filter favoring longs above the line and shorts below it, and as a benchmark for judging whether a trade was executed at a favorable price relative to the session’s overall activity.
How do I use VWAP for day trading specifically?
Many day traders watch whether price holds above or below VWAP to establish a directional bias, then look for pullbacks toward the line, breakouts through it, or reclaim and rejection patterns, often combined with volume and candlestick confirmation, as potential entry signals.
What is a VWAP trading strategy?
Common VWAP strategies include trend following, where trades are only taken in the direction price holds relative to VWAP, bounce strategies that treat the line as dynamic support or resistance, and breakout or reclaim strategies that focus on decisive crosses through the line.
What is anchored VWAP?
Anchored VWAP is a version of the indicator that a trader manually anchors to a specific, meaningful point on the chart, such as a major news event or a significant swing high or low, after which it calculates the volume weighted average price from that point forward without resetting daily, unlike standard session based VWAP.
Who is Brian Shannon in relation to VWAP?
Brian Shannon is a trader and technical analyst widely credited within the trading community for developing and popularizing the anchored VWAP concept, extending the original institutional VWAP tool into a flexible indicator that can be anchored to any significant point on a chart.
What are VWAP bands?
VWAP bands are upper and lower lines plotted at a chosen standard deviation distance above and below the core VWAP line, helping traders visualize how far price has stretched from the volume weighted average, similar in concept to Bollinger Bands built around a moving average.
What is the difference between VWAP and TWAP?
VWAP weights price by volume, giving more importance to heavily traded price levels, while TWAP, or time weighted average price, averages price evenly across time without considering volume at all.
How does VWAP compare to a moving average?
A standard moving average averages closing prices over a fixed number of periods without regard to volume and does not reset daily, while VWAP incorporates volume directly into its calculation and typically resets at the start of each new trading session.
What are the best VWAP settings for day trading?
Most traders use the default typical price source, keep the standard daily session reset enabled, and view VWAP on timeframes between one and fifteen minutes, adjusting standard deviation bands only after becoming comfortable with the core indicator.
How do I add VWAP on TradingView?
VWAP is available as a built in indicator on TradingView, accessible through the indicators menu, with options to adjust the source price, toggle standard deviation bands, and switch to the separate anchored VWAP tool for custom anchor points.
How do I use VWAP on MT5?
MetaTrader 5 does not always include VWAP by default, so traders often need to add a custom VWAP indicator through MT5’s indicator marketplace or through a file provided by their broker or a third party developer.
Is VWAP useful in crypto trading?
Yes, many crypto traders use a daily VWAP reset, often aligned to midnight UTC, and anchored VWAP is especially popular in crypto markets, frequently anchored to major price breakouts or significant highs and lows, given the continuous nature of cryptocurrency trading.
Is VWAP reliable in forex trading?
VWAP can still be useful in forex, but because the forex market is decentralized and lacks a single official volume figure, the indicator relies on tick volume from individual brokers rather than complete market wide volume data, making it a helpful but imperfect tool in currency markets.
Is VWAP a leading or lagging indicator?
VWAP is a lagging indicator, since it is calculated entirely from past price and volume data. It describes where trading has already occurred rather than predicting future price movement.
19. CONCLUSION
VWAP has earned its place as one of the most widely used indicators in modern trading, valued by institutional desks executing enormous orders and by individual day traders watching a single chart on their laptop. Its strength lies in combining price and volume into a single, continuously updating line that reflects where the real weight of trading activity has occurred during a session, offering a more meaningful benchmark than a simple average price ever could.
Throughout this guide, you have learned what VWAP is and what it stands for, the exact formula and calculation steps behind it, how to read it on a chart, and how both day traders and institutions apply it in practice. You have explored several practical VWAP trading strategies, the role of VWAP bands, the concept of anchored VWAP and its connection to Brian Shannon’s work, and how VWAP compares to related tools like TWAP and traditional moving averages. You have also seen how to apply VWAP across platforms such as TradingView and MT5, how it functions across stocks, crypto, forex, and futures, and the common mistakes and genuine limitations that come with relying on any single indicator.
As with every tool covered in this kind of guide, VWAP works best as one part of a broader, disciplined trading process rather than as a standalone signal generator. Combine it with sound risk management, realistic expectations, and thorough practice before committing meaningful capital, and treat it as a lens for understanding market activity rather than a guarantee of future price direction.
Disclaimer: This article is for educational purposes only and does not constitute financial, investment, or trading advice. Trading involves substantial risk, including the risk of losing your invested capital. Always do your own research, and consult a qualified professional where needed, before trading.