Swing trading sits in an unusual middle ground. It’s not day trading, where you’re chained to a screen watching every tick during market hours. It’s not long term investing either, where you buy and wait years without much active decision making. It’s the space between, and that’s exactly why it suits people who have a full time job, a family, or simply no interest in staring at a chart all day but still want an active hand in their trading decisions.
This is a complete, consolidated guide to swing trading, covering what most competing content splits across five or more separate articles. You’ll get a full definition and explanation of how the mechanics actually work, the difference between a swing high and a swing low and why that distinction matters, a genuine answer on the best timeframe (not a vague “it depends”), the strategies and indicators that actually hold up, how to find assets worth trading, risk management with real worked numbers, an honest assessment of whether swing trading is actually profitable, platform and prop firm considerations, and the common mistakes that quietly wreck otherwise reasonable approaches.
The goal here isn’t to sell you on swing trading. It’s to give you an accurate, complete picture so you can decide whether it fits you, and if it does, to actually do it well.
What Is Swing Trading?
Swing trading means capturing price moves over days to weeks by holding a position through the run, rather than closing it the same day or holding it for years. That’s the core of it, and everything else in this guide builds on that single definition.
You’ll sometimes see the term misspelled as “swinging trading,” a common typo that search engines still route to the same intent, so if that’s how you found this, you’re in the right place. Trading swing trading effectively, meaning actually doing it well rather than just knowing the definition, comes down to a specific set of skills covered throughout this guide: reading market structure, defining rules precisely, and managing risk across a holding period that leaves your positions exposed to news and volatility you can’t watch in real time.
Swing Trading Meaning and Definition
The swing trading meaning centers on one idea: capturing a “swing,” a single directional move within a larger trend or range, rather than trying to catch an entire multi month trend (investing) or a few minutes of intraday movement (day trading). The swing trading definition, more formally, is a trading style that holds positions from roughly a few days to a few weeks, using technical analysis on daily and multi day charts to identify entries and exits around these individual price swings.
Where Swing Trading Sits Between Day Trading and Investing
Day trading requires constant attention during market hours and closes every position before the session ends, avoiding overnight risk entirely but demanding significant time and fast decision making. Investing requires comparatively little active decision making but holds through years of volatility, relying on long term compounding rather than short term price swings.
Swing trading occupies the middle: you’re not watching every candle, but you’re checking in daily rather than quarterly. You’re accepting overnight and weekend risk, since positions stay open outside market hours, but you’re not required to be present for every tick. This middle position is precisely why swing trading has become popular among people with full time jobs. It fits around a working life in a way day trading structurally can’t.
How Does Swing Trading Work?
Understanding how does swing trading work in practice means understanding the anatomy of a single trade from start to finish, and understanding why holding fewer, larger positions changes the underlying math compared to higher frequency trading styles.
The Anatomy of a Swing Trade
Every swing trade moves through five stages.
The setup is the market condition that makes a trade worth considering: an established trend, a specific chart pattern, a level being approached. The setup alone isn’t a signal, it’s context.
The entry trigger is the specific, observable event that actually initiates the trade: a candle close beyond a level, a moving average crossover, a confirmed retest. This needs to be precise enough that you could explain to someone else exactly why you entered when you did, not a vague sense that “it looked ready.”
The stop is your predetermined exit if the trade goes against you, set before entry based on where the setup would actually be invalidated, not an arbitrary distance.
The target is where you plan to take profit if the trade works, whether a fixed level, a structural target like the next resistance zone, or a trailing mechanism that locks in gains as the move develops.
The exit is what actually happens: hitting the stop, hitting the target, or a time based or discretionary exit if the trade stalls without resolving either way. A complete strategy accounts for all three possibilities, not just the two that go according to plan.
Long vs. Short Swing Trades
A long swing trade profits when price rises: you buy, hold through the swing, and sell higher. A short swing trade profits when price falls: you sell borrowed shares (or use an instrument designed for short exposure) first, then buy back lower.
Short swing trades carry distinct considerations worth understanding before attempting them. Borrowing costs and availability vary by broker and by the specific asset. Short positions face theoretically unlimited risk, since there’s no ceiling on how high a price can rise, which makes stop discipline especially important. And short selling is generally considered a more advanced skill, often better approached only after developing consistency on the long side first.
Why Fewer, Larger Trades Change the Math
Swing trading generates far fewer trades than day trading, often single digits per week rather than dozens per day, and this changes the practical math in several ways.
Transaction costs matter proportionally less, since fewer trades mean fees and spreads consume a smaller share of overall returns. Each individual trade carries more weight, since with fewer data points, a single trade’s outcome moves your overall results more than it would in a high frequency approach, which also means a larger sample of trades is needed before you can draw reliable conclusions about whether your strategy actually works. And the psychological experience differs meaningfully: swing trading involves sitting with open risk for days at a time rather than resolving it within minutes, which tests a different kind of patience than day trading does.
Swing Highs and Swing Lows: The Core Building Blocks
Before any strategy or indicator, swing trading rests on reading price structure directly from the chart, and that structure is built from two basic elements.
What Is a Swing High in Trading?
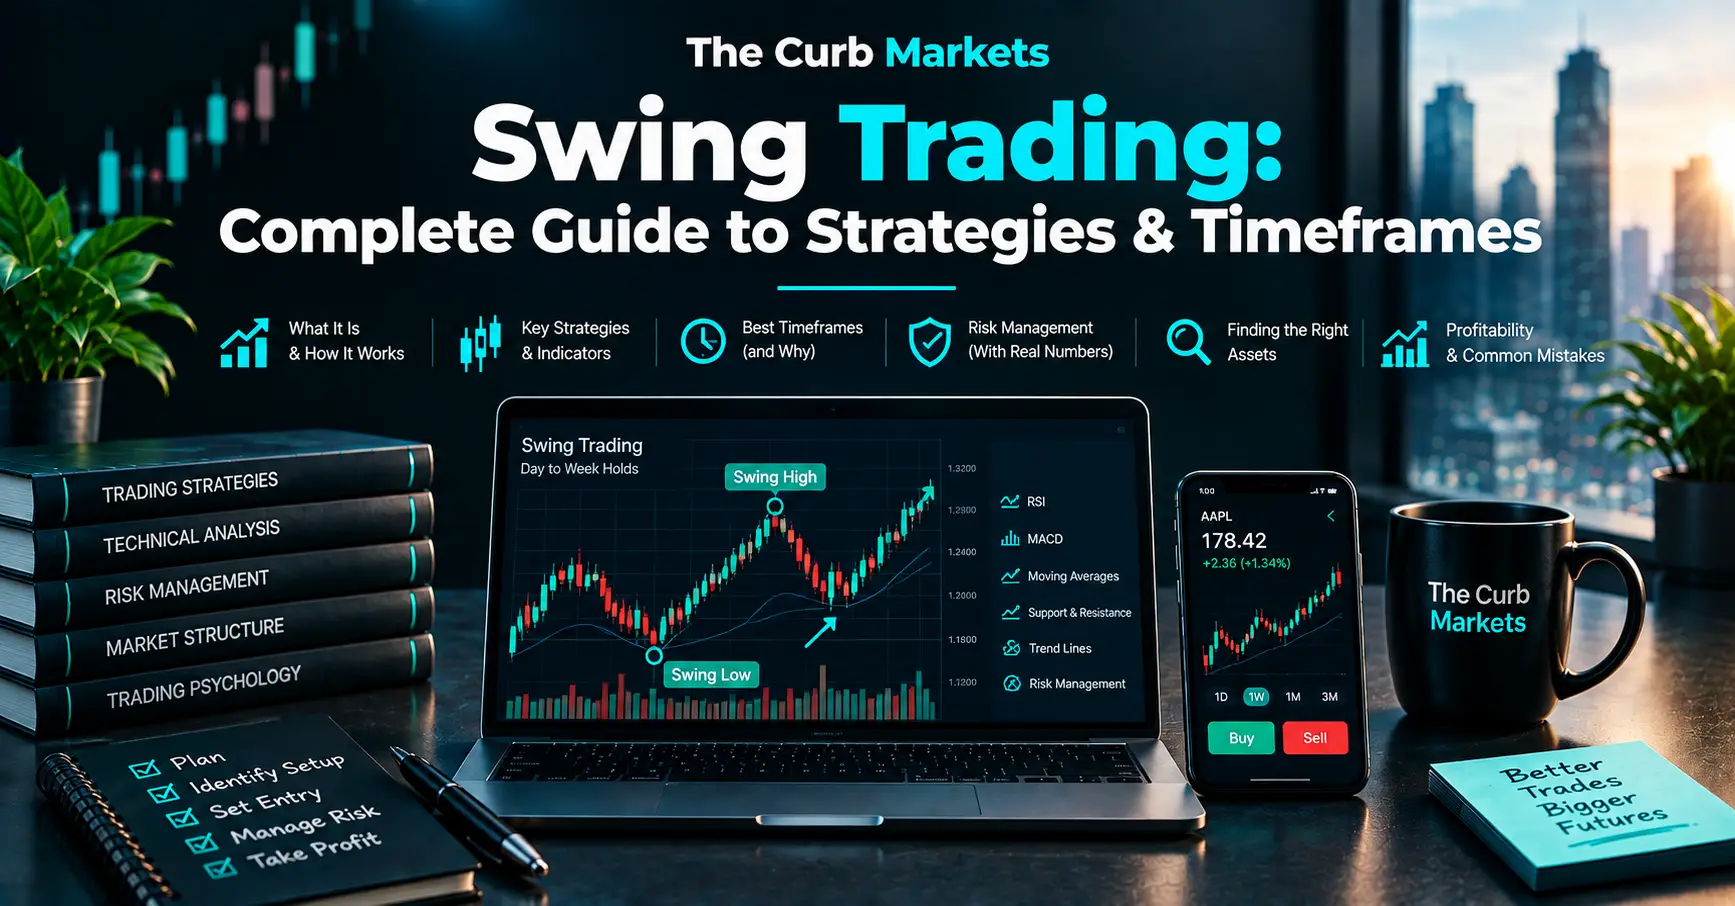
A swing high in trading is a peak, a specific candle or bar whose high is greater than the highs of the candles immediately on either side of it. Visually, it looks like a local high point with lower highs both before and after it, forming a small peak in the price structure.
Swing highs matter because they mark points where selling pressure temporarily overcame buying pressure. A sequence of rising swing highs is one half of the signature of an uptrend, and a broken swing high (price closing above a prior one) is frequently used as confirmation that upward momentum is continuing.
What Is a Swing Low in Trading?
A swing low in trading is the mirror image: a trough, a specific candle or bar whose low is lower than the lows of the candles immediately on either side of it. It looks like a local low point with higher lows both before and after it.
Swing lows mark points where buying pressure temporarily overcame selling pressure. A sequence of rising swing lows is the other half of the uptrend signature, and a broken swing low (price closing below a prior one) is frequently used as an early warning that a trend may be reversing.
Reading Market Structure With Swing Points
Market structure is simply the pattern formed by a sequence of swing highs and swing lows over time, and it’s one of the most fundamental tools in technical analysis, underlying most of the strategies covered later in this guide.
An uptrend is characterized by higher highs and higher lows: each new swing high exceeds the last, and each new swing low stays above the previous one. A downtrend shows the reverse: lower highs and lower lows. A range or consolidation shows swing highs and swing lows clustering around similar levels without a clear directional sequence.
A market structure shift, often the earliest technical signal that a trend may be changing, occurs when this pattern breaks: an uptrend failing to make a new higher high, or a downtrend failing to make a new lower low, followed by a break of the most recent opposing swing point. Recognizing this shift early, directly from swing highs and swing lows rather than waiting for a lagging indicator to confirm it, is a core skill this guide returns to throughout the strategies section.
Swing Trading vs. Day Trading vs. Position Trading
These three styles are often confused, and the practical differences matter significantly for how each is actually executed.
| Factor | Day Trading | Swing Trading | Position Trading |
|---|---|---|---|
| Holding period | Minutes to hours, closed same day | A few days to a few weeks | Months to years |
| Time commitment | High, requires active monitoring during market hours | Moderate, daily check ins rather than constant watching | Low, periodic review |
| Overnight risk | None, positions closed before session end | Yes, exposed to gaps and after hours news | Yes, but position sized for long term volatility |
| Capital requirements | Higher in regulated markets due to specific trading rules | No fixed regulatory minimum, but enough for meaningful position sizing | Lower barrier, often built up gradually |
One practical point deserves specific attention: the Pattern Day Trader (PDT) rule, which in the United States has historically been associated with a $25,000 minimum equity requirement in margin accounts once a trader executes four or more day trades within five business days, applies specifically to day trading, not swing trading. Because swing trades are generally held overnight rather than closed same day, they typically don’t count toward the day trade threshold that triggers this rule. That said, this specific dollar threshold and the rule’s exact mechanics can change, so verify the current requirement directly with your broker or a current regulatory source rather than relying on a figure that may be outdated by the time you read this.
How to Start Swing Trading: Step by Step
Here’s a practical, sequenced path for swing trading for beginners, from knowing nothing to placing an informed first trade.
Step 1: Learn the Core Concepts
Before opening a chart with intent to trade, get genuinely comfortable with market structure, swing highs and lows, support and resistance, and basic candlestick reading. This foundational layer is what everything else in this guide sits on top of, and skipping it to jump straight to indicators is one of the most common ways beginners build a shaky foundation, covered in more detail in the learning sequence subsection below.
Step 2: Choose Your Market
Decide whether you’re focusing on stocks, ETFs, forex, or another asset class, since each carries different volatility characteristics, trading hours, and typical holding period norms. Depth in one market generally teaches more, faster, than shallow exposure spread across several simultaneously.
Step 3: Pick a Platform and Set Up Charts
Choose a platform with reliable daily and 4 hour charting (the primary timeframes for swing trading, covered in detail in the next major section), and set up a clean, uncluttered chart template you’ll actually use consistently rather than rebuilding from scratch every session.
Step 4: Define One Strategy With Written Rules
Choose a single strategy from the options covered later in this guide, and write out its complete rules: setup conditions, entry trigger, stop placement, target, and position sizing. If you can’t write it down precisely enough that another trader could execute it identically, it isn’t specific enough yet to actually test.
Step 5: Paper Trade for at Least a Month
Paper trading, simulated trading using real market data without real money, lets you practice identifying setups and executing your rules without financial consequences. A full month is a reasonable minimum specifically for swing trading, since the style’s longer holding periods mean a shorter test simply won’t generate enough completed trades to learn much from.
Step 6: Start Small With Real Capital
Once you’ve paper traded a strategy you understand well, transition to real capital sized small enough that mistakes remain affordable lessons. The goal of this phase is learning to execute under genuine financial and emotional pressure, which paper trading cannot fully replicate, not maximizing early profit.
Step 7: Journal Every Trade
From your first live trade onward, record the setup, entry, stop, target, exit, and your reasoning at the time for every single trade. This journal is what turns experience into improvement rather than just repetition.
How to Learn Swing Trading Efficiently
Learning how to learn swing trading efficiently comes down to sequence, and getting the sequence wrong is one of the most common reasons beginners feel stuck despite putting in real effort.
The correct order is: structure first, then patterns, then indicators, then risk management woven throughout. Start by learning to read market structure and swing points directly from price, since this is the foundation nearly everything else depends on. Then learn to recognize the specific chart patterns and setups covered in the strategies section. Only after that, layer in indicators as confirmation tools, not as your primary decision making method. Risk management isn’t a final chapter to bolt on at the end, it should be integrated from day one, but it’s listed last here because understanding what you’re actually risking requires understanding the setup you’re risking it on.
The most common mistake in this sequence is starting with indicators, loading a chart with moving averages, RSI, and MACD before ever learning to read raw price structure. This produces a trader who can recite what an indicator is doing without understanding what the underlying price action actually means, which tends to create exactly the kind of contradictory, cluttered decision making covered later in the indicators section.
What Is the Best Time Frame for Swing Trading?
This is one of the most searched questions in swing trading, and it deserves a genuine, specific answer rather than a vague “it depends.” Here’s the direct version, with the reasoning behind it.
The Daily Chart
The daily chart is the primary timeframe for swing trading, and for most swing traders, it should be the main reference for identifying setups and trends. Signals on the daily chart tend to be more reliable than shorter timeframes, since each candle represents a full session’s worth of consensus rather than a brief, noisier window. Daily chart setups typically align with trends lasting roughly 10 to 20 days, a natural match for swing trading’s holding period.
The 4-Hour Chart
The 4 hour chart serves a specific, narrower purpose: refining entry timing within a setup already identified on the daily chart, rather than generating setups independently. Trades built around 4 hour structure typically hold for roughly 3 to 7 days. Using the 4 hour chart this way, as a timing tool subordinate to the daily trend rather than a standalone decision maker, is what keeps it useful rather than a source of noise.
The Weekly Chart
The weekly chart provides broader context: where does the current daily setup sit within the larger picture, and does the weekly trend support or contradict the direction you’re considering on the daily chart. It’s meant to be checked periodically, weekly rather than daily, as a sanity check rather than an active decision making tool.
The Multi Timeframe Workflow
A well structured swing trading workflow moves from broad to specific: daily chart for the setup and overall directional bias, 4 hour chart for structure and entry refinement, and optionally a 1 hour chart for precision entry timing.
It’s worth being explicit about a specific trap here: the 1 hour timeframe should only be added to your workflow after you’ve proven consistency using daily and 4 hour charts alone. The 1 hour chart always shows something that looks tempting, some pattern or signal that seems to demand action, precisely because shorter timeframes generate far more apparent setups than longer ones. Adding it too early, before your process on the higher timeframes is solid, tends to introduce noise and overtrading rather than genuine precision.
The “Slow Day Trading” Trap
A specific and common failure mode deserves its own explanation: executing entries and exits almost entirely off 15 minute or 30 minute charts while still calling the approach swing trading. This isn’t swing trading, it’s day trading with looser session boundaries, and it tends to produce a specific, recognizable problem: positions sized and stopped for a fast timeframe get hit constantly by completely normal daily or multi day volatility that has nothing to do with whether the original swing thesis was actually wrong.
Here’s a practical diagnostic: if your stops are getting hit routinely, not occasionally but as a consistent pattern, by what turns out to be ordinary intraday noise rather than a genuine invalidation of your setup, your timeframe is too short for the style you’re attempting. Widening your stop and reference timeframe to match the daily chart’s actual volatility is usually the fix, not tightening further.
How Holding Period Maps to Timeframe
Tying this together practically: a typical swing trade held using primarily daily chart analysis runs roughly 1 to 15 days, with the exact duration depending on the specific setup, the asset’s volatility, and how quickly the anticipated move actually develops. Trades leaning more heavily on 4 hour structure for entry tend to sit toward the shorter end of that range, while trades built around larger daily or weekly patterns tend to run longer.
Key Swing Trading Concepts: Retests, Breakouts, and Pullbacks
Several specific price behaviors show up constantly across swing trading strategies, and understanding them clearly is a prerequisite for the strategies section that follows.
What Is a Retest in Swing Trading?
A retest in swing trading occurs when price breaks through a significant level, a support or resistance zone, a trendline, a chart pattern boundary, then returns to test that same level again from the opposite side before (ideally) continuing in the direction of the original break.
The retest matters because it offers a specific advantage over simply entering at the moment of the original breakout: a level holding on retest provides confirmation that the break was genuine rather than a false move, and it typically offers a tighter, more clearly defined stop loss placement than chasing an already extended breakout. The tradeoff is that not every breakout produces a clean retest, some continue directly without looking back, meaning a trader specifically waiting for a retest can occasionally miss a move entirely.
Breakout vs. Pullback Entries
A breakout entry enters as price moves decisively beyond a level, betting that the move continues with fresh momentum. It offers the potential to catch a large portion of a move early but carries meaningfully more false breakout risk, since the level hasn’t yet been confirmed by a successful retest.
A pullback entry waits for price to retrace toward a prior level or a moving average within an already established trend, entering on the expectation that the trend resumes. It generally offers a more favorable entry price and a clearer stop location, at the cost of sometimes missing trades where the pullback never comes and price simply continues without looking back.
Neither approach is inherently superior; they suit different market conditions and different trader temperaments, a theme that recurs throughout this guide.
Role Reversal
Role reversal describes the tendency for a broken level to flip roles: previously acting as resistance, it often goes on to act as support once broken (and the reverse for support becoming resistance). This is closely related to the retest concept above, since the retest is often the specific moment this role reversal gets tested and confirmed.
The reasoning is psychological as much as mechanical: traders who bought below a resistance level expecting it to hold, and instead watched it break, are often eager to exit near breakeven if price returns to that level, creating fresh selling pressure exactly where buying pressure used to dominate (and the reverse logic applies to broken support becoming resistance). It’s a well documented, common pattern, though not a guaranteed one, and traders generally look for some confirmation on the retest itself rather than assuming the flip happens automatically.
Swing Trading Strategies
Several established swing trading strategies form the backbone of most traders’ approaches. None guarantees results, and each includes an honest look at where it tends to fail alongside where it works.
Trend Pullback Strategy
Rules: Identify an established trend using market structure (higher highs and higher lows for an uptrend). Wait for price to pull back toward a moving average or a prior support level within that trend. Entry: on a bullish reversal signal at the pullback level. Stop: below the pullback low or the relevant moving average. Target: the prior swing high, or a defined risk to reward multiple. Best conditions: clearly trending markets with orderly pullbacks rather than choppy, directionless action.
Honest caveat: this strategy underperforms significantly in range bound markets, where what looks like a pullback within a trend is often actually the start of a reversal, and repeated false signals in choppy conditions can erode an account through accumulated small losses.
Breakout Strategy
Rules: Identify a significant level, a resistance zone, a consolidation range boundary, or a chart pattern neckline. Entry: on a decisive close beyond the level, ideally with a volume increase. Stop: just beyond the opposite side of the breakout level. Target: measured move based on the pattern’s height, or the next significant structural level. Best conditions: markets building up energy in a tight range, particularly after a period of contracting volatility.
Honest caveat: false breakouts are common, and this strategy specifically requires either strict confirmation rules or acceptance of a lower win rate offset by larger average winners on the trades that do work.
Breakout Retest Strategy
Rules: Same level identification as the breakout strategy above, but rather than entering on the initial break, wait for price to return and retest the broken level. Entry: on confirmation that the retest is holding, typically a rejection candle or a bounce with some volume support. Stop: just beyond the retested level. Target: same as the breakout strategy. Best conditions: identical to breakout trading, but this variant specifically suits traders who prioritize a tighter, more confirmed entry over catching the full extent of the initial move.
Honest caveat: as covered in the retest concept section, not every breakout retests cleanly, and strictly waiting for retests means occasionally missing strong trending moves that never look back.
Reversal Strategy at Key Levels
Rules: Identify a significant, well tested support or resistance level, or an extreme reading on a momentum indicator like RSI. Entry: on a clear reversal candlestick pattern or a confirmed market structure shift at the level. Stop: just beyond the level being tested, accounting for normal overshoot. Target: the opposing significant level, or a defined risk to reward ratio. Best conditions: range bound markets, or trending markets approaching a genuinely major, well established level.
Honest caveat: reversal trading against a strong trend is among the riskier approaches in this list, since a trend that has been strong can simply continue through a level that looks significant on paper, and this strategy specifically requires discipline around cutting losses when the expected reversal doesn’t materialize.
Moving Average Crossover Strategy
Rules: Use two exponential moving averages of different periods, commonly a shorter and longer period pairing. Entry: when the shorter average crosses above the longer one (bullish) or below it (bearish), often combined with a broader trend filter to avoid trading crossovers against the dominant direction. Stop: below a recent swing low (for a bullish crossover) or a defined distance based on volatility. Target: trailing exit as the trend develops, or a fixed multiple of the initial risk. Best conditions: sustained trending markets.
Honest caveat: moving average crossovers are inherently lagging, since they’re calculated from past price, which means entries occur after a meaningful portion of the move has already happened, and this approach tends to generate frequent false signals (whipsaws) in choppy, non trending conditions.
Chart Pattern Strategies
Several classic chart patterns recur across swing trading and merit brief coverage as a group.
Head and shoulders (and its inverse) signals a potential trend reversal, formed by three peaks with the middle one highest, confirmed by a break of the “neckline” connecting the pattern’s low points.
Double top and double bottom patterns signal potential reversal at a level tested twice without breaking, confirmed by a break of the level between the two peaks or troughs.
Cup and handle signals potential continuation, formed by a rounded consolidation (the cup) followed by a smaller pullback (the handle), confirmed by a breakout above the handle’s high.
Flags and pennants signal likely continuation after a strong directional move, formed by a brief consolidation before the trend resumes, confirmed by a breakout in the direction of the prior move.
Honest caveat across all chart patterns: pattern identification is inherently somewhat subjective, two traders looking at the same chart will sometimes disagree on whether a pattern is genuinely present, which makes these patterns harder to backtest with precision than mechanically defined rules like moving average crossovers. They work best combined with the confirmation principles covered throughout this guide rather than traded on visual pattern recognition alone.
Best Indicators for Swing Trading
Indicators are tools, not strategies on their own, and the best indicators for swing trading are the ones used deliberately, each answering a specific question rather than being stacked together for a false sense of confirmation.
Exponential Moving Averages (EMA)
The EMA is frequently cited as the single most useful indicator for swing traders, largely because of its simplicity and versatility. Unlike a simple moving average, the EMA weights recent price more heavily, making it somewhat more responsive to current conditions.
EMAs serve multiple roles: identifying trend direction (price above a longer EMA generally suggests an uptrend bias), acting as dynamic support or resistance during pullbacks, and forming the basis of crossover strategies covered above. Common periods for swing trading on the daily chart include shorter EMAs (around 9 to 21) for more responsive signals and longer EMAs (around 50 to 200) for broader trend context.
RSI (Relative Strength Index)
RSI is a momentum oscillator measured on a 0 to 100 scale, with readings below 30 generally considered oversold and readings above 70 generally considered overbought. On the daily chart, a 14 period setting is the most commonly used default.
RSI’s most useful application for swing traders isn’t simply reading overbought and oversold levels in isolation, which can stay extended for long periods during strong trends. It’s most useful on divergence, when price makes a new high or low that RSI doesn’t confirm with a corresponding new high or low, since this divergence can be an early signal that momentum is fading even while price is still moving in the prior direction.
MACD (Moving Average Convergence Divergence)
MACD is built from two EMAs, commonly the 12 and 26 period, with a 9 period EMA of their difference plotted as a signal line. The relationship between the MACD line and the signal line, and the histogram representing their difference, is used to gauge momentum shifts.
MACD is best used as confirmation, not as a standalone signal generator. Treating a MACD crossover in isolation as a trade trigger tends to produce frequent false signals, particularly in choppy markets, since MACD is itself a derivative of price that lags the underlying action. Used alongside price structure and another primary signal, it adds useful confirming context about momentum.
Bollinger Bands
Bollinger Bands plot a moving average with bands set a defined number of standard deviations above and below it, expanding and contracting based on volatility. A key application for swing traders is identifying volatility squeezes, periods where the bands narrow significantly, often preceding a substantial directional move as volatility expands again.
Bollinger Bands measure volatility and relative price position, not direction, so they’re generally used alongside other tools that provide directional bias rather than as a standalone entry signal.
ATR (Average True Range)
ATR measures the average range an asset moves over a given period, expressed in price units rather than as a directional signal. It’s primarily used for stop sizing rather than for deciding trade direction, covered in detail in the risk management section ahead, where a common approach ties stop distance to a multiple of current ATR so that stop placement adapts to each asset’s actual typical volatility rather than using a fixed, arbitrary distance.
Volume
Volume, the number of shares or contracts traded, serves primarily as a confirmation tool for swing traders rather than a standalone signal. A breakout accompanied by a clear volume increase carries more weight than the same price move on unusually light volume, since higher volume suggests broader participation and conviction behind the move rather than a temporary spike likely to fail.
How to Combine Indicators Without Cluttering Your Chart
The layered principle is the single most useful concept for using indicators well: each tool on your chart should answer one specific question, not overlap with what another tool already tells you. A reasonable structure might use an EMA for directional bias, price structure and a specific entry trigger for timing, RSI or MACD for momentum confirmation, and ATR for stop sizing, four distinct roles rather than four overlapping opinions on the same question.
It’s worth stating this warning plainly: stacking multiple similar indicators, several moving averages, several oscillators, all answering essentially the same directional question, tends to produce contradictory signals and decision paralysis rather than added confidence. When one indicator says buy and another says wait, and a third is ambiguous, the trader is left worse off than with a single, clear framework. More indicators is not more information if they’re all measuring variations of the same underlying thing.
How to Find Stocks (or Assets) to Swing Trade
Strategy and indicators only matter once applied to a reasonable candidate, and finding good candidates is its own skill.
Liquidity
Liquidity, how easily an asset can be bought and sold without significantly moving its price, matters enormously for swing trading. Low liquidity assets tend to have wider spreads, increasing the practical cost of entering and exiting, and can gap more severely and unpredictably overnight, precisely the kind of risk swing traders are already exposed to simply by holding positions outside market hours.
Volatility
Volatility, how much an asset’s price tends to move over a given period, needs to be matched to your strategy and risk tolerance rather than maximized indiscriminately. Enough volatility is needed to produce meaningful swings worth trading, but excessive volatility relative to your position sizing and stop placement can turn a well reasoned setup into a stop out driven more by noise than by the thesis actually being wrong.
Relative Strength vs. the Index
Relative strength compares an individual asset’s performance to a broader benchmark, typically a relevant market index. An asset showing strength relative to its index during a broad market advance, or relative weakness during a decline, often signals genuine underlying interest or disinterest specific to that asset, beyond what overall market direction alone would explain, and many swing traders specifically screen for this relative behavior when building watchlists.
Using Scanners and Watchlists
Scanners filter a broad universe of assets down to a manageable list meeting specific criteria, such as unusual volume, a significant price move, or proximity to a key technical level. This narrows what would otherwise be an unmanageable task of manually reviewing hundreds of charts down to a focused, relevant watchlist worth actually reviewing in detail.
A maintained watchlist, reviewed and refreshed regularly rather than built once and forgotten, keeps your attention on assets that actually fit your strategy’s criteria rather than reacting to whatever happens to be trending in the news on a given day.
Catalysts
Catalysts, specific events likely to drive meaningful price movement, include earnings announcements, product launches, regulatory decisions, and broader sector or macroeconomic news. Being aware of upcoming catalysts for assets on your watchlist matters two ways: some swing traders specifically look for setups building ahead of a known catalyst, while others deliberately avoid holding through major catalysts given the unpredictable, often gap driven price behavior they can produce.
Risk Management for Swing Traders
Risk management matters more in swing trading than strategy selection, since even a strong strategy fails to survive poor risk management, while disciplined risk management can make a mediocre strategy viable.
The 1-2% Rule
The standard framework risks a small, fixed percentage of total account equity per trade, commonly cited as somewhere well under 2 percent, with many experienced traders using 1 percent or less specifically. This isn’t an arbitrary convention. It’s what allows a trader to survive an inevitable losing streak without that streak threatening the overall account, which matters especially in swing trading given the smaller number of total trades and correspondingly larger impact of any single one.
Position Sizing Calculation
Here’s a worked example showing how this translates into an actual position size. Suppose you have a $10,000 account, and you’re willing to risk 1 percent per trade, or $100. You’ve identified a setup where your entry is $50 and your stop loss, based on the actual structure of the trade, sits at $47, a $3 per share risk. Dividing your dollar risk by your per share risk gives your position size: $100 divided by $3 equals approximately 33 shares. That position, if the stop is hit, loses close to your intended $100, regardless of the total dollar value of the position itself.
This calculation is what ties your stop placement (determined by the trade’s structure) to your position size (determined by your risk tolerance), rather than the reverse, which is a common mistake: deciding position size first based on how much capital “feels right” to deploy, then figuring out risk afterward.
ATR Based Stop Placement
A common, more adaptive approach to stop placement ties the stop distance to a multiple of ATR rather than a fixed dollar or percentage distance, so that stops scale with each asset’s actual typical volatility. Commonly cited references include roughly 1.5 times ATR when working primarily off the 4 hour chart, and roughly 2 times ATR when working primarily off the daily chart, though the appropriate multiple varies by strategy and asset and these figures should be treated as a starting reference rather than a fixed rule.
It’s worth reframing something that beginners often experience as counterintuitive: a wider stop, sized appropriately to an asset’s actual volatility, is a feature that absorbs normal price noise, not a flaw that increases risk. A stop placed too tight relative to an asset’s typical movement gets triggered by ordinary fluctuation that has nothing to do with whether your original thesis was correct, which is a version of the “slow day trading” trap covered earlier in this guide.
Risk to Reward Ratios
The risk to reward ratio describes the relationship between what you’re risking and what you stand to gain if the trade works, and understanding it changes what a “good” win rate actually means. A strategy with a sub 50 percent win rate, meaning it loses more often than it wins, can still be genuinely profitable if winning trades average meaningfully more than losing trades, since overall profitability depends on the combination of both frequency and magnitude rather than win rate alone.
This is a specific and important corrective to a common beginner intuition, which tends to overvalue a high win rate in isolation. A strategy that wins 40 percent of the time with winners averaging three times the size of losers is mathematically solid; a strategy that wins 70 percent of the time but occasionally allows a loss to run far larger than typical wins can lose money overall despite the impressive sounding win rate.
Managing Overnight Gap and Weekend Risk
Overnight and weekend risk is structurally different from the intraday risk a stop loss is designed to manage, and it’s worth understanding this distinction clearly, since it’s specific to holding positions the way swing trading requires. A stop loss order generally executes at or near your specified price during active trading, but it cannot protect against a gap, when price opens at a significantly different level than where it closed, since there’s no opportunity to execute at intermediate prices during a closed market.
Because stops can’t fully protect against gap risk, position sizing becomes the primary defense instead. Sizing positions conservatively enough that even an adverse gap beyond your intended stop distance remains a manageable, survivable loss is the practical answer, rather than assuming your stop guarantees a specific maximum loss on every trade. This is one of the more important, and more often overlooked, risk realities specific to swing trading as a style, distinct from day trading’s ability to close out before any overnight exposure occurs.
Swing Trading Psychology
More swing trading accounts are damaged by psychology than by any single flawed strategy, and the specific psychological demands of this style differ somewhat from day trading’s faster paced pressures.
Patience is the core skill. Swing trading requires sitting with open, uncertain risk for days at a time, resisting the urge to act simply because waiting feels uncomfortable. This is a fundamentally different demand than day trading’s fast decision making, and it doesn’t come naturally to everyone, regardless of how sound their underlying strategy is.
Resisting the urge to check lower timeframes after entry is a specific, recurring trap. A trade entered on a sound daily chart setup can look alarming on a 1 hour chart hours later, simply because shorter timeframes exhibit more apparent noise and volatility that has nothing to do with whether the original daily thesis remains valid. Checking a position obsessively on timeframes shorter than the one it was actually planned on tends to produce premature, unnecessary exits driven by noise rather than genuine signal.
Handling drawdowns without abandoning a tested strategy connects directly to the backtesting and sample size concepts covered elsewhere in trading education generally: every strategy experiences losing streaks, and abandoning an approach after a statistically ordinary rough patch prevents ever accumulating enough trades to evaluate it fairly.
Avoiding overtrading in slow markets matters because swing trading’s lower trade frequency can create restlessness, an urge to force trades during quiet periods simply to feel active, rather than waiting for genuine setups matching your actual criteria. This impulse, left unchecked, tends to produce exactly the lower quality, marginal trades that erode results over time.
Is Swing Trading Profitable? An Honest Assessment
This deserves a genuinely honest answer, not marketing optimism and not blanket discouragement.
What Realistic Returns Look Like
You’ll encounter aggressive claimed figures across trading content and marketing, sometimes citing monthly returns in the range of 20 to 25 percent, or weekly figures around 5 percent. These figures should be treated with real skepticism. They represent outlier results or marketing claims rather than realistic, sustainable norms, and compounding a 20 to 25 percent monthly return, if it were genuinely sustained, would produce implausibly enormous returns within a short number of years, a mathematical red flag worth recognizing on its own.
Widely varying claims exist across the trading education and marketing space, and this guide won’t present any single specific return figure as an established, reliable fact, because no such reliably verified figure exists for what a typical swing trader actually earns. What’s consistently documented is that most retail traders, across trading styles generally, underperform these kinds of marketed figures substantially, and a meaningful proportion don’t achieve consistent profitability at all, particularly in their early years.
Is Swing Trading Worth It?
The honest answer: it can be, for a genuinely disciplined minority of traders who develop and stick to a tested process, manage risk consistently, and treat the skill development period as a multi month to multi year investment rather than expecting fast results. It’s a poor fit, and arguably not worth it, for someone looking for a reliable, immediate source of income, or someone unwilling to accept the real learning curve and drawdown periods involved.
Swing trading is generally not a reliable sole income source early on, and treating it that way, particularly under financial pressure to generate consistent returns quickly, tends to produce exactly the kind of emotionally driven, oversized decision making that damages accounts.
Can Swing Trading Beat the S&P 500 or VTI?
This deserves a genuinely balanced answer rather than a sales pitch for active trading.
The case for the index: broad market index funds tracking something like the S&P 500 or a total market fund like VTI offer long run compounding with near zero ongoing effort, minimal fees, and comparatively favorable long term tax treatment in many jurisdictions when held for extended periods. Historically, broad market indices have delivered solid long run returns without requiring the skill development, active time investment, or emotional discipline that active trading demands.
The case for swing trading: in favorable conditions, and in the hands of a skilled, disciplined trader, swing trading’s more active, selective approach can theoretically outperform a passive index, since it isn’t structurally required to hold through every drawdown the broader market experiences and can, in principle, selectively target stronger performing individual assets. That ceiling exists.
The honest reconciliation: swing trading also carries costs an index fund largely avoids, transaction costs across many more trades, generally less favorable short term tax treatment in many jurisdictions given the shorter holding periods involved, substantial time investment in learning and ongoing execution, and genuine execution risk, meaning the gap between a strategy’s theoretical performance and what an individual trader actually achieves in practice. Consistently outperforming a broad market index over long periods is difficult, and the well documented reality is that most active traders, across styles and experience levels, do not achieve it. This guide won’t claim swing trading reliably beats indexing, because the honest evidence doesn’t support that claim as a general rule, even though it doesn’t rule out the possibility for a disciplined, skilled minority.
Capital Requirements
Unlike day trading, swing trading carries no fixed regulatory minimum comparable to the Pattern Day Trader rule, since positions are generally held overnight rather than closed same day. That said, practical capital requirements still matter: your account needs to be large enough that 1 to 2 percent risk per trade remains a meaningful dollar amount after accounting for transaction costs, since risking a very small dollar amount on a small account can mean fees consume a disproportionate share of any potential gain. There’s no single correct starting number, but thinking through this cost proportion before starting is worth the exercise.
The Best Platform for Swing Trading
Platform choice matters differently for swing traders than for day traders, given the difference in monitoring intensity and trade frequency.
What Actually Matters
Multi timeframe charting with reliable daily and 4 hour data is the core requirement, given how central these two timeframes are to the workflow covered earlier in this guide.
Scanners and alerts matter critically for swing traders specifically because, unlike day traders, swing traders aren’t watching charts continuously. A reliable alert system that notifies you when a setup condition triggers is what allows the style to actually fit around a job or other commitments, rather than requiring you to manually check charts throughout the day regardless.
Journaling functionality, whether built into the platform or handled separately, supports the trade review habit covered throughout this guide as one of the most important improvement mechanisms available to any trader.
Overnight financing costs, sometimes called swap rates or holding costs depending on the specific market and instrument, apply to certain account types and instruments when positions are held overnight, and given that swing trading positions are held overnight by definition, these costs are worth understanding and comparing directly, since they compound differently than a day trader’s fee structure would.
Charting vs. Execution Platforms
Some traders use separate platforms for charting and analysis versus actual order execution, particularly when a broker’s built in charting tools are more limited than a dedicated charting service’s. This isn’t necessary for everyone, particularly beginners who may find a single, integrated platform simpler to manage, but it’s worth knowing this split exists as your needs become more specific over time.
This guide intentionally doesn’t declare a single “best” platform, since features, pricing, available markets, and overall quality change over time and vary by region and account type. Research current, independent comparisons at the time you’re actually choosing one, focused on the specific factors covered above rather than marketing claims.
Learning Resources: Courses and Educators
Are Swing Trading Courses Worth It?
An honest answer here: the core concepts covered throughout this guide, market structure, strategy types, indicators, and risk management, are freely available through diligent self study. What a paid swing trading course genuinely sells isn’t secret, unavailable information, it’s sequencing, structure, and feedback: a curated learning path, a community or mentor to ask questions of, and accountability that pure self study can lack.
Whether that’s worth paying for is a genuinely personal calculation depending on your learning style and how much you value structure and feedback over self directed research. What’s worth a clear, direct warning is courses sold specifically on the basis of unverified, often extraordinary profit claims, the same category of overstated returns covered in the profitability section earlier in this guide.
Reasonable vetting criteria before paying for any course include: a verified, ideally third party or independently auditable track record rather than self reported screenshots alone, transparent and genuinely honored refund policies, no aggressive pressure toward opening an account with a specific affiliate broker, and an absence of guaranteed return language, since no legitimate educator can honestly guarantee trading results.
Finding Swing Trading Educators on YouTube
This guide won’t name specific channels, since quality varies enormously and channels change over time in ways a static list can’t track reliably. Instead, here’s a set of evaluation criteria worth applying to any educator you’re considering learning from.
Do they show losing trades, not just curated winners. A trader or educator who only ever shows profitable examples is presenting a distorted, incomplete picture, whether intentionally or not. Do they explain risk management specifically and in detail, rather than treating it as an afterthought to more exciting entry and exit content. Do they avoid selling trading signals, meaning specific buy and sell alerts to follow rather than teaching you to develop your own process, since signal selling businesses often have incentives that don’t fully align with your actual trading education. And do they disclose affiliate relationships clearly, particularly with brokers or platforms they recommend, since undisclosed financial incentives can quietly shape what’s presented as objective advice.
Free Learning Path
A concrete, self directed sequence: start by learning to identify swing highs, swing lows, and basic market structure directly on a chart, using free charting tools, without any indicators at all initially. Move to studying the classic chart patterns and strategy types covered in this guide, practicing identifying them on historical charts. Layer in the core indicators, EMA, RSI, MACD, one at a time, understanding what each specifically adds rather than stacking them all at once. Paper trade a single, simple strategy for at least a month, following the process covered in the step by step section earlier. Throughout, maintain a trading journal from the very first paper trade onward, since this habit, more than any specific resource, is what turns study into genuine skill development over time.
Swing Trading Prop Firms
Prop trading firms have grown as an option across trading styles, but it’s worth being direct: most prop firms are structurally built around intraday trading, and swing traders specifically need to check several details that don’t matter as much to a day trader evaluating the same firm.
What Prop Firms Offer Swing Traders
Prop firms typically require passing an evaluation, a structured challenge demonstrating consistent, rule following trading performance, often for a fee, after which a trader who passes may gain access to a funded account and a share of the profits generated. For a swing trader, this can offer access to more capital than personal savings alone would provide, though it comes with firm specific rules that can meaningfully constrain how a swing strategy is actually executed.
What to Check Before Choosing One
Weekend and overnight holding policy deserves the first and most careful check, since many prop firms restrict or outright prohibit holding positions overnight or over weekends, a restriction that is functionally disqualifying for genuine swing trading regardless of how favorable the firm’s other terms might be. Confirm this specific policy directly and explicitly before considering a firm further.
Drawdown model matters significantly and varies meaningfully between firms: static versus trailing, and end of day versus intraday measurement. A static, end of day drawdown model generally suits swing trading better than a trailing, intraday model, since the latter can penalize normal overnight price fluctuation on an open position even when the trade hasn’t actually been stopped out, a mismatch that specifically disadvantages a style built around holding through exactly that kind of fluctuation.
News trading restrictions vary by firm and can constrain a swing trader’s ability to hold positions through scheduled news events, relevant given how directly this connects to the catalyst awareness covered in the asset selection section earlier.
Profit split matters more for a swing trader executing perhaps 10 to 20 trades per month than it would for a high frequency scalper, since fewer total trades mean each one’s terms carry proportionally more weight in overall results.
Evaluation time limits matter specifically for swing trading, since a strategy holding positions for days to weeks needs a realistic evaluation window to demonstrate its actual process, and an evaluation period too short for the style’s natural trade frequency can force rushed, poorly fitting trades that don’t reflect how the trader would actually operate with more time.
Risks and Trade Offs
Evaluation fees are generally non refundable regardless of outcome, representing a real, upfront cost with no guarantee of passing. Firm rules can force exits at genuinely bad moments, for instance a daily loss limit triggering a forced closure during a normal, temporary drawdown that a personally funded account could have simply held through. And terms vary enormously between firms and change over time, which means research needs to be current and specific rather than based on generalized assumptions about how prop firms work as a category. This guide doesn’t name specific firms, precisely because policies in this space shift frequently enough that a static recommendation would likely be outdated quickly.
Common Swing Trading Mistakes
Several recurring mistakes account for a disproportionate share of swing trading account damage, and most are avoidable with direct awareness.
Using too short a timeframe while calling the approach swing trading, the “slow day trading” trap covered in detail earlier, produces stops hit by ordinary noise rather than genuine invalidation.
Overcomplicated charts stacked with redundant indicators answering overlapping questions produce contradictory signals and decision paralysis rather than added clarity, as covered in the indicators section.
Stops too tight for the actual timeframe being traded is closely related to the timeframe mistake above, and it’s worth specifically checking whether your stop distance reflects the asset’s real, typical volatility on your chosen chart, rather than an arbitrary or emotionally comfortable distance.
Ignoring gap exposure by sizing positions as though a stop loss provides complete protection, when in fact overnight and weekend gaps can move price straight through a stop level without executing at the intended price, is a specific risk swing trading carries structurally, covered in the risk management section.
Strategy hopping after normal losing streaks prevents ever accumulating enough trades with any single approach to evaluate it fairly, since every strategy, even a genuinely sound one, experiences statistically normal rough stretches.
No journal makes it nearly impossible to honestly identify recurring patterns in your own results, since memory alone tends to overweight notable wins and underweight the steady accumulation of smaller losses.
Sizing by conviction instead of a fixed rule means position size grows with how confident a trade “feels” rather than following the consistent percentage risk framework covered earlier, which quietly reintroduces exactly the kind of inconsistent, emotionally driven risk taking that disciplined position sizing is specifically designed to prevent.
Risks of Swing Trading
Swing trading carries genuine, structural risks that deserve full, direct treatment rather than a brief afterthought before the FAQ.
Overnight gap risk is the structural risk that stop loss orders fundamentally cannot protect against, since a gap can move price straight through a stop level during closed market hours with no opportunity for the order to execute at the intended price. This is covered in detail in the risk management section, and it’s specific to swing trading’s holding period in a way day trading structurally avoids.
Weekend and news exposure compounds this risk further, since positions held over a weekend are exposed to any news or events occurring while markets are closed, with no ability to react until the next session opens, potentially at a significantly different price.
Capital loss, including total loss, is genuinely possible. Swing trading can result in losing a significant portion, or the entirety, of capital allocated to it, particularly during a learning period when mistakes are more frequent and risk management habits are still being built.
Leverage risk applies to swing trading in markets or account types where margin or leverage is used, magnifying both gains and losses, and requiring specific additional caution around position sizing given the extended holding periods and associated gap exposure already covered above.
Opportunity cost versus passive investing deserves honest acknowledgment: time and capital committed to actively learning and executing swing trading is time and capital not simply invested passively, and as covered in the S&P 500 comparison section earlier, most active traders don’t reliably outperform a broad index over long periods, which makes this opportunity cost a genuine consideration rather than a minor footnote.
This is educational content only and does not constitute financial advice. It is not a recommendation to trade any specific asset, strategy, or market. Swing trading carries significant risk, including the potential loss of all capital invested, and outcomes are never guaranteed. Consider consulting a licensed financial advisor about your specific circumstances, and only trade with capital you can genuinely afford to lose.
Swing Trading and Taxes
Tax treatment for swing trading varies by country and is a brief overview here only, not tax advice for your specific situation. In many jurisdictions, the shorter holding periods typical of swing trading, generally under a year and often much shorter, mean gains are more likely to be treated as short term for tax purposes, which frequently carries a different, often less favorable tax rate than longer term holding periods in jurisdictions that make this distinction. Specific rules, rates, and thresholds vary substantially by country and change over time, so consult a qualified tax professional familiar with trading activity in your specific jurisdiction rather than relying on general guidance for actual filing decisions.
Frequently Asked Questions
Is this guide good for someone who wants swing trading for dummies?
Yes, this guide is specifically built to serve as a complete beginner resource: it covers the full definition, mechanics, timeframes, strategies, indicators, risk management, and an honest assessment of profitability, all in one place, without assuming prior trading knowledge or requiring a separate simplified resource to fill in gaps.
How much money do I need to start swing trading?
There’s no fixed regulatory minimum for swing trading, unlike day trading’s Pattern Day Trader threshold. Practically, your account needs to be large enough that a 1 to 2 percent risk per trade remains a meaningful dollar amount after transaction costs, but the specific number depends on your broker, market, and typical position sizing, and no single figure applies universally.
How many hours a day does swing trading require?
Considerably fewer than day trading. Most swing traders check charts once or a few times daily, often outside active market hours entirely, rather than monitoring continuously throughout the session, which is precisely why the style suits people with other daytime commitments.
Can you swing trade with a full time job?
Yes, and this is one of swing trading’s primary practical advantages over day trading. Since positions are checked periodically rather than monitored continuously, many swing traders review charts and manage positions in the morning before work, in the evening after work, or during brief breaks, using alerts to flag when a position needs attention rather than watching constantly.
Is swing trading better than day trading?
Neither is universally better; they suit different lifestyles, capital levels, and temperaments. Swing trading generally requires less daily time commitment and avoids the higher capital thresholds associated with frequent day trading in regulated markets, but it accepts overnight and weekend gap risk that day trading structurally avoids by closing positions before the session ends.
How long does it take to become profitable swing trading?
There’s no universal timeline, and claims of a short, specific path should be treated skeptically. Developing genuine, consistent skill typically takes a multi month to multi year learning curve, and given swing trading’s lower trade frequency compared to day trading, it can take longer in calendar time to accumulate a large enough sample of trades to meaningfully evaluate and refine a strategy.
Do I need Level 2 data for swing trading?
No, Level 2 data, a real time view of the order book, is generally considered unnecessary for swing trading specifically, since it’s most relevant to very short term, intraday execution decisions that aren’t central to a style built around daily and multi day chart analysis.
What’s the minimum timeframe I should use for swing trading?
The daily chart should be your primary reference, with the 4 hour chart used for entry refinement. Relying primarily on timeframes shorter than 4 hour, such as 15 or 30 minute charts, tends to drift into the “slow day trading” trap covered earlier in this guide, where stops sized for a fast timeframe get hit by ordinary daily noise unrelated to the original setup.
Can beginners really learn swing trading on their own, without a paid course?
Yes, genuinely. The core concepts covered throughout this guide, market structure, strategy types, indicators, and risk management, are all learnable through diligent self study and consistent practice, including paper trading. A paid course can add structure and feedback that some learners find valuable, but it isn’t a prerequisite for developing real skill.
What’s the biggest single mistake beginners make in swing trading?
Based on how consistently it recurs across the mistakes and psychology sections of this guide, using too short a timeframe while calling it swing trading is among the most common and most damaging, since it produces stops hit by ordinary volatility rather than genuine setup invalidation, eroding an account through accumulated small losses that have nothing to do with whether the underlying strategy actually works.
Conclusion
Swing trading rewards patience and process far more than it rewards speed or indicator selection. The daily chart, a single tested strategy with written rules, and genuinely disciplined position sizing matter more to long term results than which specific EMA period or oscillator setting you choose.
This guide covered the full picture deliberately, because most competing content splits it across five or more separate articles, and that fragmentation makes it easy to miss how these pieces connect: your timeframe choice determines your realistic holding period, your holding period determines your gap exposure, your gap exposure determines why position sizing matters more than stop placement alone, and your strategy only means anything once it’s actually been tested rather than assumed to work.
Swing trading is learnable, and it’s genuinely well suited to people who want an active hand in their trading without day trading’s constant screen time. It is not a guaranteed or fast path to income, and the honest evidence doesn’t support claims that it reliably outperforms simple, low cost index investing over the long run for most people who attempt it. Whether it’s worth pursuing depends on your own temperament, available time, and willingness to treat the first months as genuine skill development rather than expected income.
If this guide gave you a complete, honest foundation, the practical next step is straightforward: learn to read market structure directly from a chart, choose one strategy, paper trade it for a full month, and build from there with discipline rather than urgency.