
Most beginners start their trading journey by opening a chart crowded with a dozen conflicting indicators, hoping one of them will tell them what to do next. Somewhere along the way, many of them discover a simpler approach: reading the price itself, before layering anything else on top of it. That approach is price action trading, and it is the subject of this guide.
Price action trading is not a shortcut and it is not secret knowledge. It is a discipline built on observing how price actually behaves: where it has found support, where it has met resistance, how it forms highs and lows, and what candlestick and chart patterns tend to precede. This guide walks through the full picture: what price action trading actually is, the core concepts that everything else builds on, the candlestick and chart patterns worth knowing, practical strategies with honest limitations attached, how volume and Fibonacci retracement fit in as supporting tools rather than standalone systems, and how to manage risk once you actually place a trade.
We will also cover what to look for in a price action course or a price action trading book, since that market is just as full of exaggerated marketing as any other corner of trading education. By the end, you should have a genuinely useful framework, not a list of patterns to memorize and hope for the best with.
What Is Price Action Trading?
Price action trading means analyzing markets and making trading decisions based primarily on raw price movement, rather than relying primarily on lagging indicators layered on top of a chart. A price action trader watches candles, highs, lows, and the structure they form, and treats that as the main source of information.
The reasoning behind this approach comes down to one simple fact: every indicator, whether it is a moving average, an oscillator, or a momentum tool, is mathematically derived from historical price. That means an indicator can only confirm what price has already done, after the fact. A moving average crossover, for example, only occurs once price has already moved enough to produce it. Price action trading tries to work closer to the source, reading the raw movement itself rather than a delayed summary of it.
This does not mean indicators are useless, and it does not mean price action trading is free of interpretation. It means the primary decision making tool is the chart itself: candles, structure, and levels, read in context.
Why Traders Use Price Action Instead of Indicators
The main appeal of price action trading is timing. Because indicators are derived from past price and often smoothed over a period of time, they tend to confirm a move well after it has already started. A trader reading price directly, watching a pin bar form at a key level or a clean break of structure, can often identify an opportunity earlier and with less lag than someone waiting on an indicator signal.
Price action also works across every market and every timeframe. The same core concepts, support and resistance, market structure, candlestick behavior, apply whether you are looking at forex, stocks, commodities, indices, or crypto, and whether you are on a one minute chart or a weekly chart. That universality is part of why the approach has such a long history across so many types of markets.
It is worth being balanced here: many experienced price action traders still use a small number of indicators, most commonly a moving average or a volume tool, as a layer of confirmation rather than as the primary decision making tool. Price action trading, done well, is not about dismissing indicators entirely. It is about not depending on them as the first or only source of information.
Core Price Action Concepts
These four concepts form the foundation that every candlestick pattern, chart pattern, and strategy in this guide builds on. If you only take one section from this entire guide, make it this one.
Market Structure
Market structure describes the pattern of highs and lows a market is forming over time. In an uptrend, price typically forms a series of higher highs and higher lows: each rally pushes above the previous high, and each pullback holds above the previous low. In a downtrend, the opposite happens: a series of lower highs and lower lows.
A break of structure occurs when this pattern is interrupted, for example when an uptrend fails to make a new higher high and instead breaks below the most recent higher low. This is often an early signal that the prevailing trend may be changing, though it is not a guarantee on its own. Some traders further distinguish a smaller, earlier warning sign they call a change of character, a shift in the rhythm of highs and lows that often precedes a full break of structure.
Support and Resistance
Support is a price level where buying pressure has historically been strong enough to halt or reverse a decline. Resistance is the opposite: a level where selling pressure has historically capped an advance. These levels are not exact lines so much as zones, since price rarely reverses at the exact same number twice.
Support and resistance matter because they represent areas where market participants have previously shown a clear reaction. When price returns to one of these zones, traders watch closely for signs of the same reaction repeating, or for a clean break through the level, which often signals the start of a larger move.
Trend Lines
A trend line connects a series of higher lows in an uptrend, or lower highs in a downtrend, giving a visual read on the angle and health of a trend. A trend line that price respects repeatedly, bouncing off it several times, is generally considered more significant than one drawn through only two points.
A break of a well established trend line, particularly combined with a break of structure, is one of the more common signals price action traders use to flag a potential trend change.
Supply and Demand Zones
A supply and demand zone is an area on the chart where a strong, often rapid price move originated, implying a significant imbalance between buyers and sellers at that level. When price later returns to that same zone, traders watch for the same imbalance to reassert itself, producing a reaction similar to the original move.
Supply and demand zones are conceptually related to support and resistance, but they are typically drawn as a wider zone rather than a single level, and they place more emphasis on the strength and speed of the original move that created the zone.
Candlestick Patterns in Price Action Trading
Candlestick patterns are one of the most visible building blocks of price action trading, and they matter most when they form at a meaningful level, such as a support or resistance zone, rather than in isolation in the middle of a range.
Pin Bar
A pin bar has a small body and a long wick extending in one direction, showing that price moved sharply one way during the candle before being rejected and closing back near its open. A pin bar with a long lower wick at a support level suggests buyers stepped in and rejected lower prices. A pin bar with a long upper wick at resistance suggests the same from sellers. It matters most at a key support or resistance zone, where the rejection carries more weight than it would in open space.
Engulfing Candle
An engulfing candle is a two candle pattern where the second candle’s body fully covers, or engulfs, the body of the candle before it, in the opposite direction. A bullish engulfing candle at support suggests buyers have overwhelmed the prior selling pressure. A bearish engulfing candle at resistance suggests the reverse. This pattern matters most after a clear prior move, since it signals a potential shift in control between buyers and sellers.
Inside Bar
An inside bar is a candle whose entire range, high to low, sits inside the range of the candle before it. It generally signals a period of consolidation or indecision, often appearing before a breakout in either direction. Inside bars matter most when they form within a clear trend or just below a significant level, since a breakout from the inside bar can then align with the larger structure.
Doji
A doji is a candle where the open and close are very close together, producing a small or nearly nonexistent body, regardless of how far price traveled during the candle. It generally signals indecision between buyers and sellers. A doji matters most after an extended trend or at a significant support or resistance level, where it can hint that the prevailing momentum is running out of conviction.
| Pattern | What It Looks Like | What It Signals | Matters Most |
|---|---|---|---|
| Pin Bar | Small body, long single wick | Rejection of price in the wick’s direction | At support or resistance |
| Engulfing Candle | Second body fully covers the first, opposite direction | Shift in control between buyers and sellers | After a clear prior move |
| Inside Bar | Range sits fully inside the prior candle | Consolidation, potential breakout ahead | Within a trend or near a key level |
| Doji | Open and close nearly equal | Indecision, possible momentum exhaustion | After an extended trend or at a key level |
Price Action Chart Patterns
Where candlestick patterns form over one or two candles, price action chart patterns form over a longer sequence of price movement and tend to carry more significance once completed.
Flags and Pennants
A flag is a short, roughly parallel consolidation channel that slopes against the direction of the preceding strong move, sometimes called the flagpole. A pennant is similar but converges into a small triangle rather than a parallel channel. Both generally signal a pause before the prior trend resumes, and traders commonly measure the length of the flagpole to project a target once price breaks out of the consolidation.
Double Top and Double Bottom
A double top forms when price rallies to a resistance level, pulls back, rallies again to roughly the same level, and fails to break through, producing two peaks at a similar height. It generally signals that buying pressure is exhausted at that level. A double bottom is the mirror image at support, generally signaling that selling pressure is exhausted. Both patterns are typically confirmed once price breaks the level between the two peaks or troughs, known as the neckline.
Head and Shoulders
A head and shoulders pattern consists of three peaks: a left shoulder, a higher central peak called the head, and a right shoulder roughly matching the height of the left shoulder. It generally signals a potential trend reversal from an uptrend to a downtrend, and it is typically confirmed once price breaks below the neckline connecting the lows between the shoulders and the head. An inverse head and shoulders is the same pattern upside down, generally signaling a potential reversal from a downtrend to an uptrend.
Wedges
A wedge is a converging channel where both boundary lines slope in the same direction, either both rising, called a rising wedge, or both falling, called a falling wedge. A rising wedge within an uptrend often signals weakening momentum and a potential reversal lower. A falling wedge within a downtrend often signals the opposite. Wedges can also appear as continuation patterns depending on where they form relative to the larger trend, so context matters more than the shape alone.
Price Action Trading Strategies
Each strategy below includes a realistic setup, an entry trigger, where a stop might reasonably be placed, a target, and an honest limitation, since no price action strategy works in every condition.
Trend Pullback Strategy
Setup: an established trend showing a clear sequence of higher highs and higher lows, or lower highs and lower lows, with price pulling back toward a trend line, moving average, or prior support or resistance level that now aligns with the trend’s direction.
Entry trigger: a candlestick signal, such as a pin bar or engulfing candle, forming at the pullback level in the direction of the larger trend.
Stop placement: just beyond the recent swing high or low that would invalidate the pullback thesis if broken.
Target: the most recent swing high in an uptrend, or swing low in a downtrend, with some traders scaling out and trailing the remainder.
Honest limitation: this strategy performs poorly in choppy, range bound conditions where pullbacks frequently fail to resume the prior trend, so trend strength should be assessed before entry.
Breakout and Retest Strategy
Setup: a well defined level, such as horizontal resistance, a trend line, or the edge of a flag or wedge, that price approaches after building pressure against it.
Entry trigger: a decisive break of the level followed by a retest where price returns to the level and shows a rejection candle in the direction of the breakout.
Stop placement: just beyond the retested level, on the side that would invalidate the breakout.
Target: the next significant level or a measured move based on the size of the prior consolidation.
Honest limitation: false breakouts are common, particularly around widely watched levels, and waiting for the retest reduces but does not eliminate this risk, sometimes at the cost of a worse entry price.
Range Reversal Strategy
Setup: a market moving sideways between a clearly defined support and resistance boundary, with price approaching one edge of the range.
Entry trigger: a rejection candlestick pattern, such as a pin bar or doji, forming at the range boundary, ideally with some volume confirmation.
Stop placement: just beyond the range boundary being traded against.
Target: the opposite side of the range, or a partial target at the midpoint.
Honest limitation: ranges eventually break, and this strategy performs poorly right at that transition, since the same rejection pattern that worked repeatedly inside the range can fail the moment the range breaks down.
Multi Timeframe Confluence Strategy
Setup: identifying a higher timeframe level or trend direction first, for example on a daily or four hour chart, then dropping to a lower timeframe, such as a one hour or fifteen minute chart, to look for a price action signal aligning with that higher timeframe context.
Entry trigger: a candlestick or chart pattern on the lower timeframe that lines up with the higher timeframe level or trend, increasing overall confluence.
Stop placement: based on the lower timeframe structure, typically beyond the swing point that triggered the entry.
Target: informed by the higher timeframe level or structure, since that is usually where the larger move is likely to meet resistance or support.
Honest limitation: this approach takes more screen time and more practice to execute consistently, and it can produce fewer signals overall, since a trader is effectively waiting for two timeframes to agree rather than acting on either alone.
Using Fibonacci Retracement With Price Action
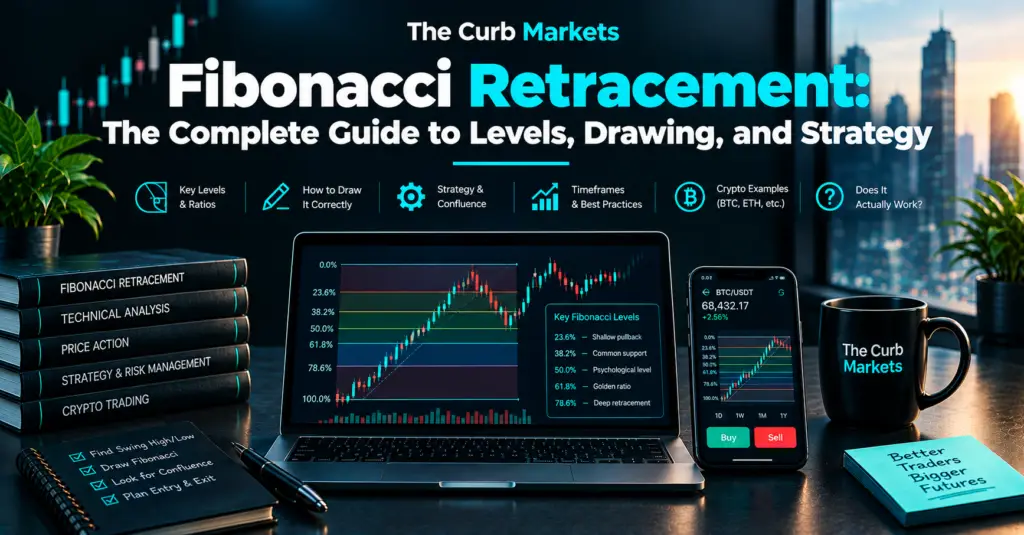
Fibonacci retracement is a tool that measures potential pullback levels within a trend, based on a sequence of ratios applied to a prior price swing. Among these ratios, the 61.8 percent and 78.6 percent levels are commonly treated as confluence points, areas worth watching more closely when they line up with an existing support, resistance, or supply and demand zone. The zone between these two levels is sometimes referred to as the golden pocket.
It is worth being clear about what this tool is and is not. Fibonacci retracement is not a standalone trading system, and a Fibonacci level with nothing else backing it up, no candlestick signal, no structural level, no trend line, carries far less weight than one that lines up with several of those other concepts at once. Treat it as one tool among several rather than the deciding factor on its own.
Volume Confirmation in Price Action Trading
Volume represents the amount of trading activity behind a given price move, and it functions as a filter for significance. A breakout on unusually high volume generally carries more weight than the same breakout on thin volume, since it suggests broader participation rather than a move driven by a small number of orders.
It is worth noting that as more market participants rely on algorithmic systems reacting to the same classic levels and patterns, volume confirmation has become a more reliable way to filter out noise from genuinely significant moves. A level that many participants are watching, confirmed by a real increase in volume, tends to be more meaningful than the same level with no such confirmation behind it.
Risk Management and Trade Execution
Even a strong price action setup means little without disciplined risk management behind it. This section covers the practical side of actually placing and managing a trade.
Setting a Stop Loss
A stop loss should be placed beyond the point that would invalidate the original trade thesis, not at an arbitrary fixed distance from entry. For a pullback trade, that typically means beyond the swing point that defines the pullback. For a breakout and retest trade, that typically means beyond the retested level. Placing a stop based on invalidation, rather than a round number or a fixed percentage, keeps the stop tied to the actual reason the trade was taken.
Take Profit Targets
A reasonable take profit target is usually the next significant level, such as a prior swing high or low, a measured move projected from a chart pattern, or a defined resistance or support zone. Many traders scale out a portion of the position at a first target and let the remainder run with a trailing stop, balancing locking in gains against capturing a larger move if the trend continues.
Risk to Reward Ratio
The risk to reward ratio compares the distance to the stop loss against the distance to the target. A favorable ratio, for example risking one unit to potentially gain two or three, allows a trader to be profitable over time even without needing an unusually high win rate. This is one of the more overlooked aspects of price action trading: a strategy with a modest win rate can still be solidly profitable if the average winning trade is meaningfully larger than the average losing trade.
Position Sizing
Position sizing refers to how much capital is put at risk on any single trade, typically expressed as a small, fixed percentage of total account size, commonly in the range of one percent or less per trade among more conservative traders. Consistent position sizing protects an account from a single bad trade or a losing streak causing disproportionate damage, regardless of how confident a setup appears.
Price Action Trading Course: What to Look For
A genuinely useful price action course focuses on teaching the underlying framework, market structure, key levels, candlestick and chart pattern context, and gives students real chart examples to practice reading on their own, ideally with some form of feedback or review process built in.
There are also warning signs worth watching for in course marketing specifically. Guaranteed win rates or promised returns are not something any honest course can back up, since markets do not work that way. A course that only ever shows winning trade screenshots, with no losses discussed, is giving an incomplete and misleading picture of what trading actually involves. High pressure, limited time offers pushing an immediate purchase decision have more in common with general sales tactics than with legitimate trading education.
It is also worth knowing that a substantial amount of price action education is freely available, through books, articles, and practice on historical charts. A paid course’s real value, when it has genuine value, tends to come from structure, a clear learning path, and feedback on your own analysis, rather than from access to information that is otherwise locked away.
Price Action Trading Books
Marketing around this topic sometimes leans on a “secrets” framing, implying that price action trading involves hidden or exclusive information. It is worth being direct about this: price action itself is not secret information, since it is simply the publicly visible price data that every market participant can already see. What actually varies between resources is how clearly a particular book explains the underlying framework, and how much deliberate practice a reader puts in after reading it. A title alone does not determine how useful a resource will be.
With that context in mind, several well established books are commonly recommended in this space. Trading Price Action by Al Brooks is a well known, detailed multi volume treatment of reading price bar by bar. Naked Forex by Alex Nekritin and Walter Peters focuses specifically on trading without indicators in the forex market. Price Action Breakdown by Laurentiu Damir offers a more concise, practically focused introduction to core price action concepts. As with any book recommendation, availability, editions, and pricing can change, so it is worth independently verifying current details before purchasing.
Price Action Across Markets and Timeframes
The core concepts covered in this guide, market structure, support and resistance, candlestick behavior, and chart patterns, apply broadly across forex, stocks, commodities, indices, and crypto. The underlying logic of buyers and sellers reacting at meaningful levels does not fundamentally change from one asset class to another, though liquidity and typical volatility do vary between them.
These same concepts also scale from very short timeframes up to very long ones, from a one minute chart used by an active day trader up to a weekly chart used by a longer term swing trader. The main difference across timeframes is noise level: lower timeframes tend to produce more false signals and more random looking movement, while higher timeframes tend to filter out much of that noise, at the cost of fewer overall trading opportunities.
Common Mistakes in Price Action Trading
Several mistakes show up repeatedly among newer price action traders, and recognizing them early can save a lot of frustration.
- Trading patterns in isolation, without considering the broader trend or whether the pattern is forming at a meaningful support or resistance level, significantly weakens the reliability of any given signal.
- Ignoring volume entirely removes a useful filter that helps separate significant moves from random noise.
- Using too many concepts at once, trying to apply every pattern and every tool covered in this guide simultaneously, tends to create confusion rather than clarity. A smaller, well understood toolkit generally outperforms an attempt to use everything at once.
- Confusing price action with market structure specifically is a common conceptual error. Market structure is one component of price action, not the entire discipline, and candlestick behavior, levels, and volume all matter alongside it.
- Overtrading in ranging, low conviction conditions, taking every minor signal rather than waiting for genuinely favorable setups, tends to erode an account through accumulated small losses and transaction costs.
Risks and Limitations of Price Action Trading
Price action trading carries real risks and limitations that are worth stating plainly rather than glossing over.
Interpretation is genuinely subjective. Two traders looking at the same chart can reasonably disagree about whether a pattern is valid, where a level actually sits, or whether structure has truly broken. This subjectivity is inherent to the discipline and does not disappear with more experience, though it typically becomes more consistent with practice.
Past patterns do not guarantee future behavior. A pattern that has historically preceded a certain outcome can fail at any time, and no amount of historical study eliminates that uncertainty.
Capital loss risk applies regardless of methodology. Price action trading is not inherently safer than any other trading approach, and disciplined risk management remains essential no matter how sound a given analysis appears.
This guide is educational content, not financial advice, and past patterns discussed throughout do not guarantee future results. Any trading decision carries the risk of loss, and readers should evaluate their own risk tolerance and, where appropriate, seek independent professional advice before trading.
Frequently Asked Questions
Is price action trading good for beginners?
It can be, since it builds a foundational skill, reading a chart directly, that carries over into almost any other trading approach. It does require patience, since interpreting structure and levels well takes practice, and it is not necessarily faster to learn than an indicator based approach.
How long does it take to learn price action trading?
This varies considerably by individual and by how much deliberate chart practice a trader puts in. Many traders describe a meaningful improvement in reading price after several months of consistent, focused practice, though genuine consistency across varying market conditions typically takes considerably longer.
Does price action work without any indicators at all?
Yes, price action can be traded using only raw price, candlesticks, and structure, and many traders do exactly that. Others choose to use a small number of indicators alongside price action as an additional layer of confirmation rather than as a replacement for it.
What timeframe is best for price action trading?
There is no single best timeframe, since it depends on a trader’s available time, temperament, and goals. Lower timeframes suit traders who can watch markets actively but involve more noise, while higher timeframes suit traders with less available time and typically produce cleaner, though less frequent, signals.
Is price action trading more reliable than indicator based trading?
Neither approach is inherently more reliable in every situation. Price action tends to offer earlier signals with less lag, while indicators can offer more mechanical, rules based consistency. Many experienced traders combine elements of both rather than treating them as mutually exclusive.
Can price action trading be automated?
Some elements, such as identifying certain candlestick patterns or measuring structure, can be coded into rules and automated to a degree. Fully automating the contextual judgment involved in reading confluence across multiple factors is considerably harder, and most price action approaches remain primarily discretionary.
Do I need to learn every pattern in this guide to trade price action successfully?
No. Most experienced price action traders settle on a relatively small set of concepts and patterns they understand deeply and apply consistently, rather than attempting to use every pattern covered here. Depth of understanding on a smaller toolkit tends to outperform shallow familiarity with a large one.
Is a price action trading course worth paying for?
It depends on the individual course and the individual trader. Since much of the underlying material is freely available, a paid course’s value typically comes down to structure, a clear learning path, and feedback, rather than access to otherwise unavailable information. Evaluate any course against the warning signs covered in the course section above before paying for one.
Conclusion
Price action trading rewards patience, context, and a small, well understood toolkit far more than it rewards collecting every pattern and indicator available. The traders who tend to do well with this approach are the ones who deeply understand a handful of concepts, market structure, key levels, a few candlestick patterns, and apply them consistently with sound risk management, rather than those chasing every new pattern they come across.
This guide has covered the full framework: what price action trading actually means, the core structural concepts everything builds on, the candlestick and chart patterns worth knowing, honest strategies with their real limitations, and how tools like Fibonacci retracement and volume fit in as supporting evidence rather than standalone systems. None of it guarantees results, and price action trading, like any trading approach, carries genuine risk of loss.
If you are just starting out, resist the urge to master everything in this guide at once. Pick a small set of concepts, practice reading them on historical charts, and build from there. That patient, focused approach is closer to how price action trading actually works in practice than any shortcut ever will be.