
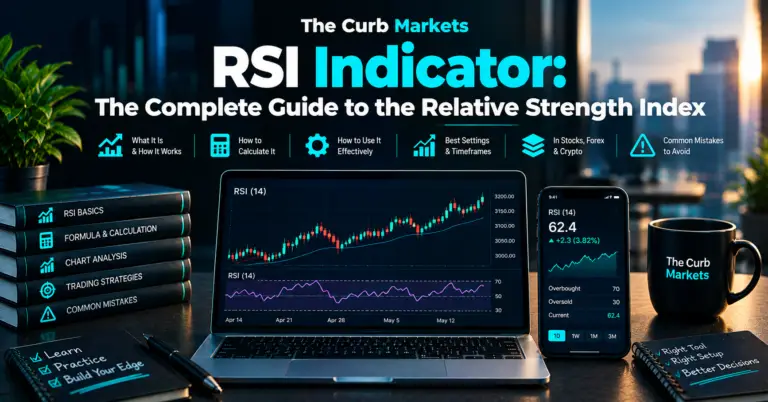
RSI Indicator: The Complete Guide to the Relative Strength Index
If you’ve spent any time looking at a price chart, you’ve probably seen it: a wavy line bouncing between 0 and 100, usually sitting below the main chart with two dashed lines at 30 and 70. That’s the RSI indicator, the Relative Strength Index, and it might be the most widely used, and most widely…